
TweetyQ Logo
TweetyQ is an award winning project that I built along with three other teammates at HackCU IV in Boulder, CO. Our project took home the First Prize in Twitter's Best Use of the Twitter Public API award!! As a first time hacker, it was an incredible experience to work with three other incredibly talented and seasoned hackers on a project that is intended to heighten people's awareness of sensitive content on the Twitter platform.
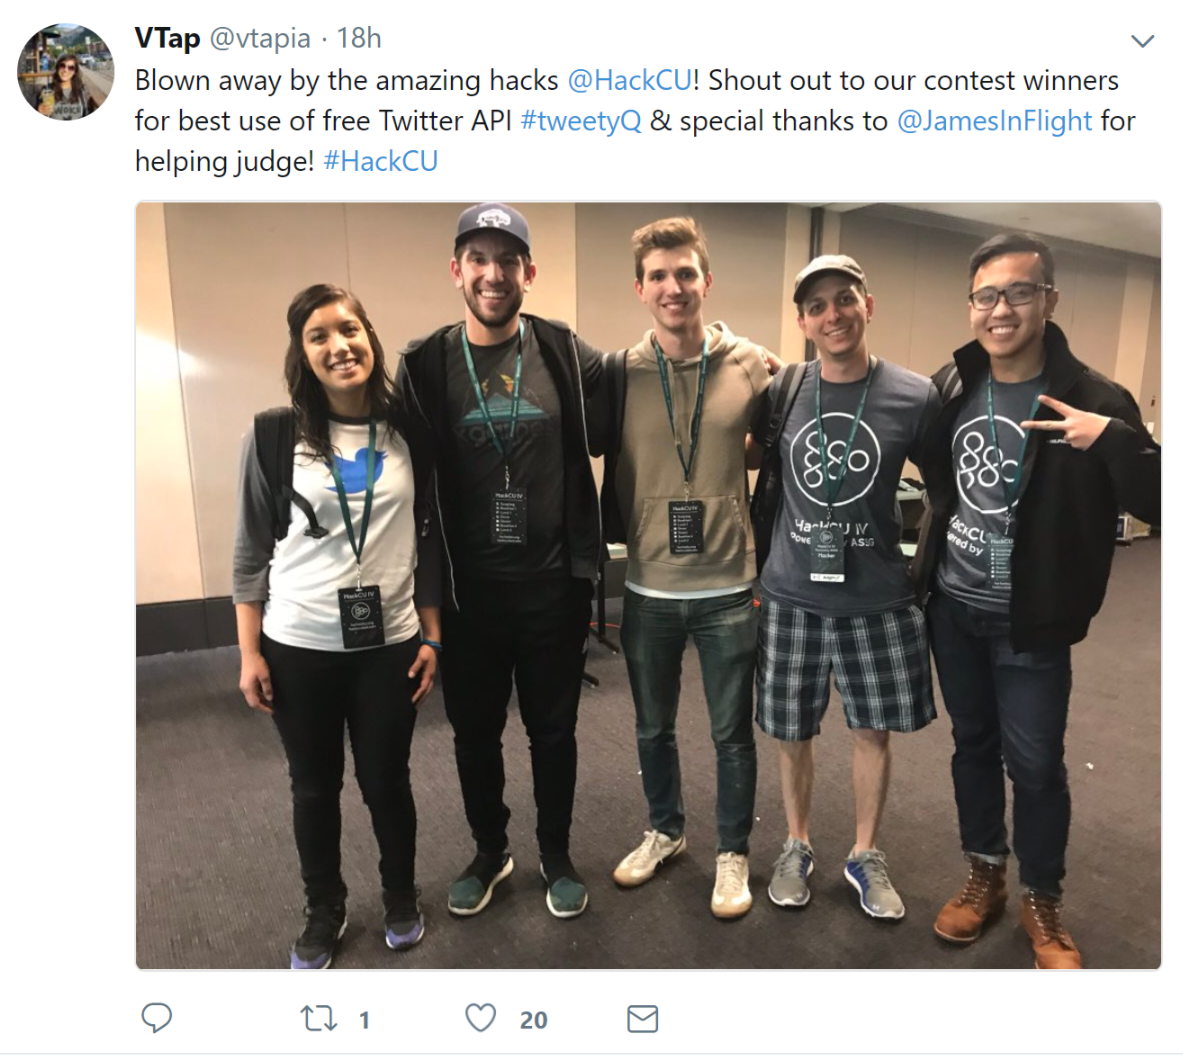
Click Image to View Tweet
We were inspired by current events to create this overlay for Twitter to help users navigate the Twitter platform in a more pleasant and informed manner. Fake news, bot accounts, malicious users and more are all things that have made social media platforms in 2018 more stressful to navigate than ever before. The truth has never been harder to find and we hope that this software can take steps to help people be more aware on Twitter.
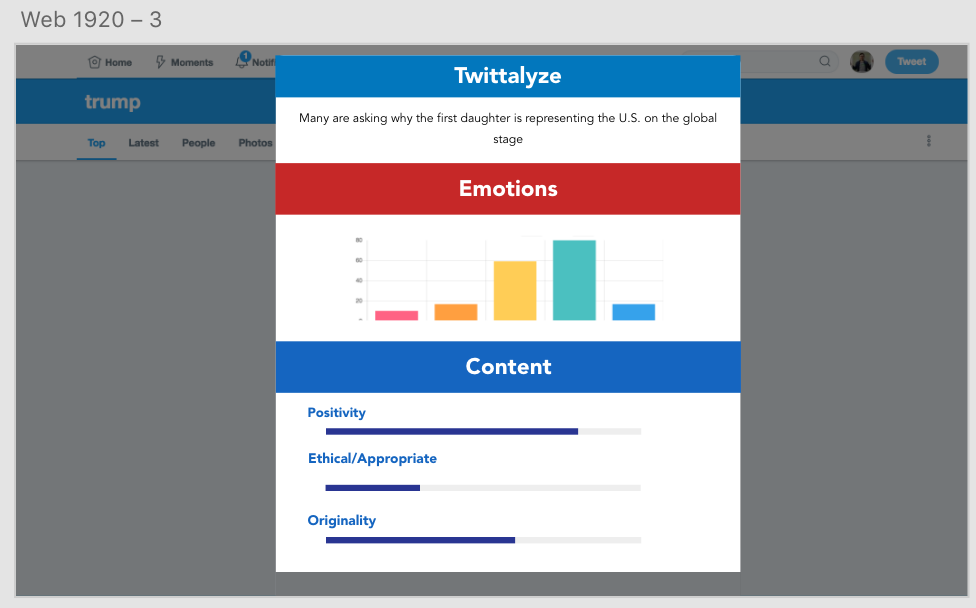
Demo image of our Chrome overlay on Twitter
What's next for tweetyQ
We would love to be able to extend this to multiple social media platforms in the future beyond just Twitter. Detecting hate speech and directed malicious messages is something that we were working on but weren't able to fully optimize so we would like to be able to continue improving these algorithms with better classifiers. Furthermore, we would be very interested in integrating more machine learning models to greater improve the personality and functionality of the platform. This is because human communication has so many nuances, and only with specially tailored models are we able to differentiate certain types of content, malicious or non.
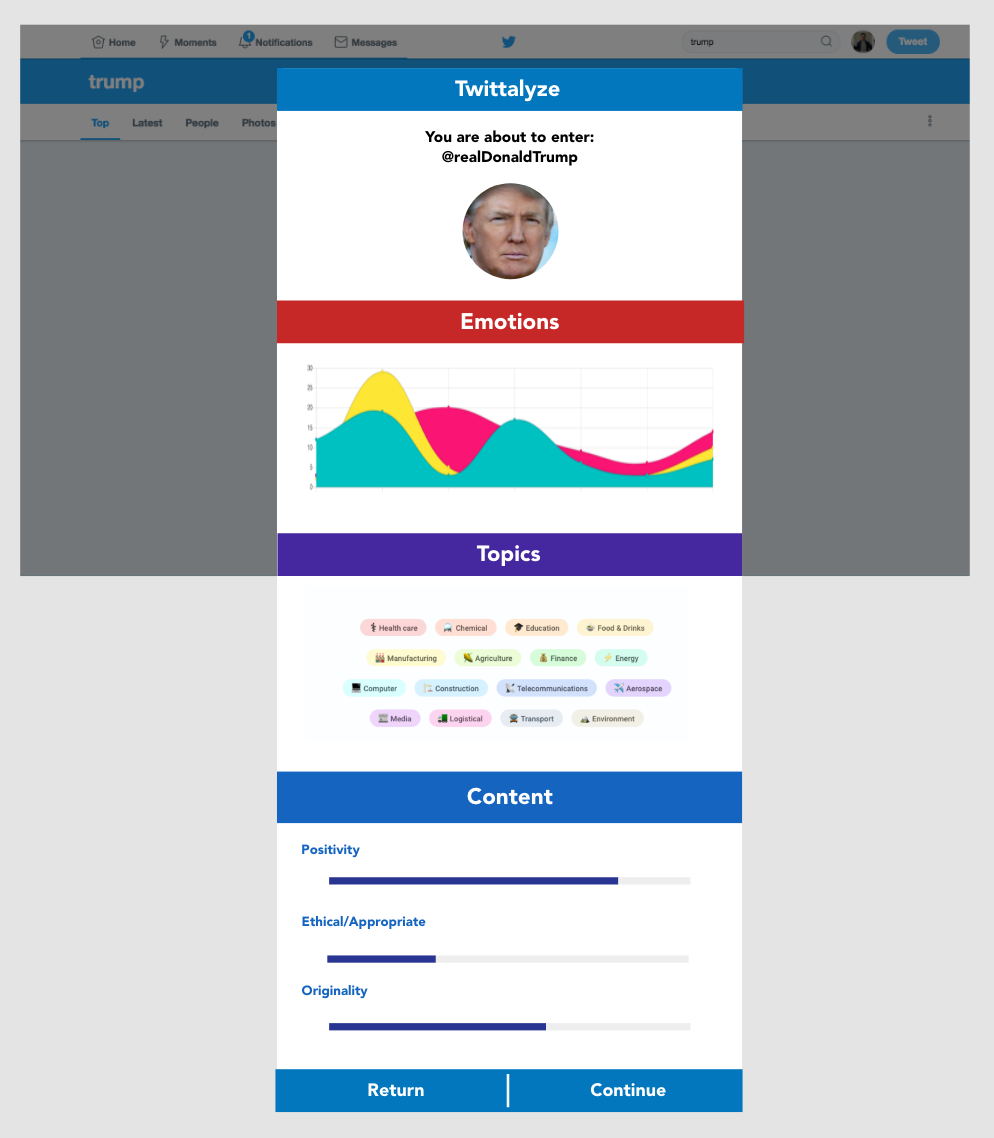
Example User Analysis Screen
What it does
This software is built as a chrome extension for Twitter. The product overlays on top of the Twitter website and analyzes tweets and users that appear on the page in real time. Users can gain insight into deeper qualitative analysis' of a fellow Twitter users profile as well as masking sensitive material in a streamlined, unobtrusive manner. We provide the user with multiple data points when referring to tweets and individual users. For example, when viewing analytics for an individual tweet, users can gauge the emotional content of the tweet by viewing our bar graph with five emotional criteria: Anger, Sadness, Joy, Disgust, and Fear. By giving these feelings a quantitative value, we can visually inform a user about difficult to process topics, especially when there is so much content available on this platform. Our goal is to make people more conscientious of their feelings and emotions when viewing a variety of content on the platform, and how their interactions with the platform may be impacting themselves.
How we built it
Initially, we decided that we would build this platform using Node.js on a web-page which we would then convert to a chrome extension later on. Hours into the process, we ran into some major problems with the Node platform and decided to do a full 180 to python for much of our back-end functionality. This presented us with some serious challenges, however, great preparation paid off. Since we organized and delegated responsibility early, we were able to accomplish almost all the aspects of this project we wanted to pull of even with the total turn around!
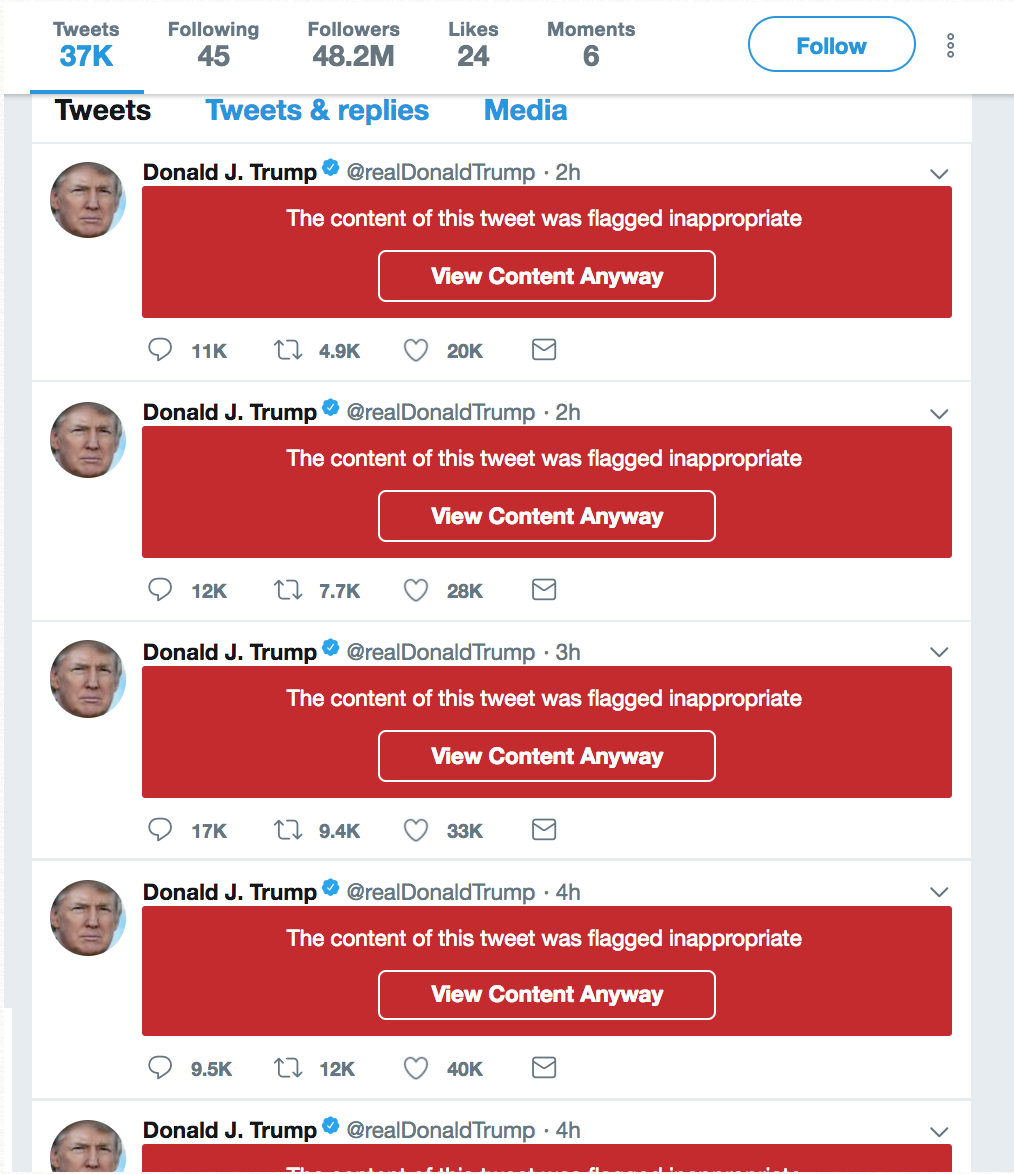
Example Masking of Potentially Sensitive Data
Challenges we ran into
We ran into quite a few challenges along the way. Our most prevalent one was passing data information between different scripts and pages we were each writing at first. Eventually once we got to know each other better, this challenge faded as we all understood the tendencies of the others. We also struggled occasionally to line up the needs of the front end with the functionality of the back-end. We were able to come together and communicate better to overcome this issue, and better understand the needs and abilities of each side.
Accomplishments that we're proud of
We're very proud of our ability to pivot and change direction in our project execution, hours into the competition beginning (in the middle of the night). We were concerned when we made the change that this would become an insurmountable challenge, and yet we pulled it all together. We are also really proud of our ability to be able to quantitatively visualize qualitative, emotional data using the Watson AI. Utilizing this AI engine was incredibly helpful, and hugely insightful into the emotional states of people on Twitter.

Logos created by Aidan Rafferty (Aspects credit of The Noun Project)
Contributors
Special Thanks to...
Twitter
Vanessa Tapia
James Cranston
HackCU
Major League Hacking