As meditation as become a more accepted form of stress relief, personal reflection, and mental conditioning we have begun to hear more about it from health gurus and scientists alike. It can be difficult to understand or believe these findings as they come from very different sources with very different reputations.
The goal of this project is to show visually how the brain changes during these times of mental exercising and how that differs from our day to day activity.
Background
Pathos I is a visualization of brain wave data collected by an Electroencephalography (EEG) device to explore and visualize the inner workings of the human mind while practicing meditation. Harnessing the natural electrical activity in the brain, viewers will better understand the actions taking place in the brain during a deep meditation practice.
The project is composed of over 400,000 digitally rendered particles whose positions, velocities, and colors are manipulated by nearly 58,000 data points.
I chose to title this project "Pathos I" because the purpose was to evoke emotion in the audience and give them a greater sense of empathy towards the practice of meditation.
Often it can be difficult for newcomers to meditation to understand the physiological effects taking place in the mind. Reading studies and data may help some believe in the activity taking place, but others may not be convinced. With this project I wanted to capture the actual physical changes happening in electrical brain signals, and create a visual representation of this.

What is an EEG?
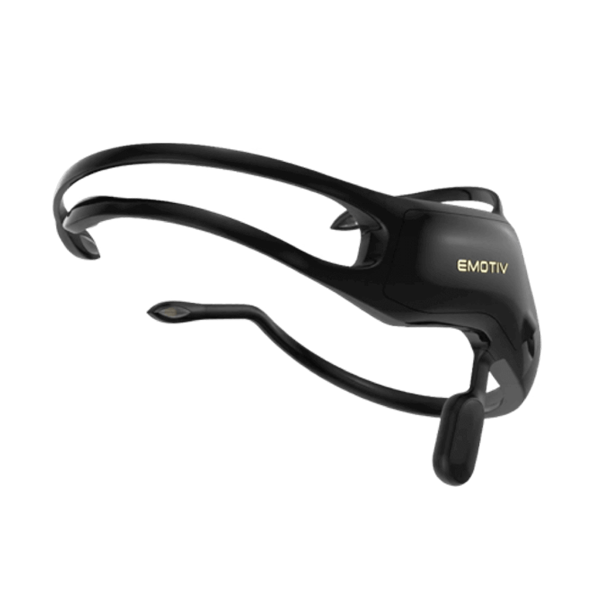
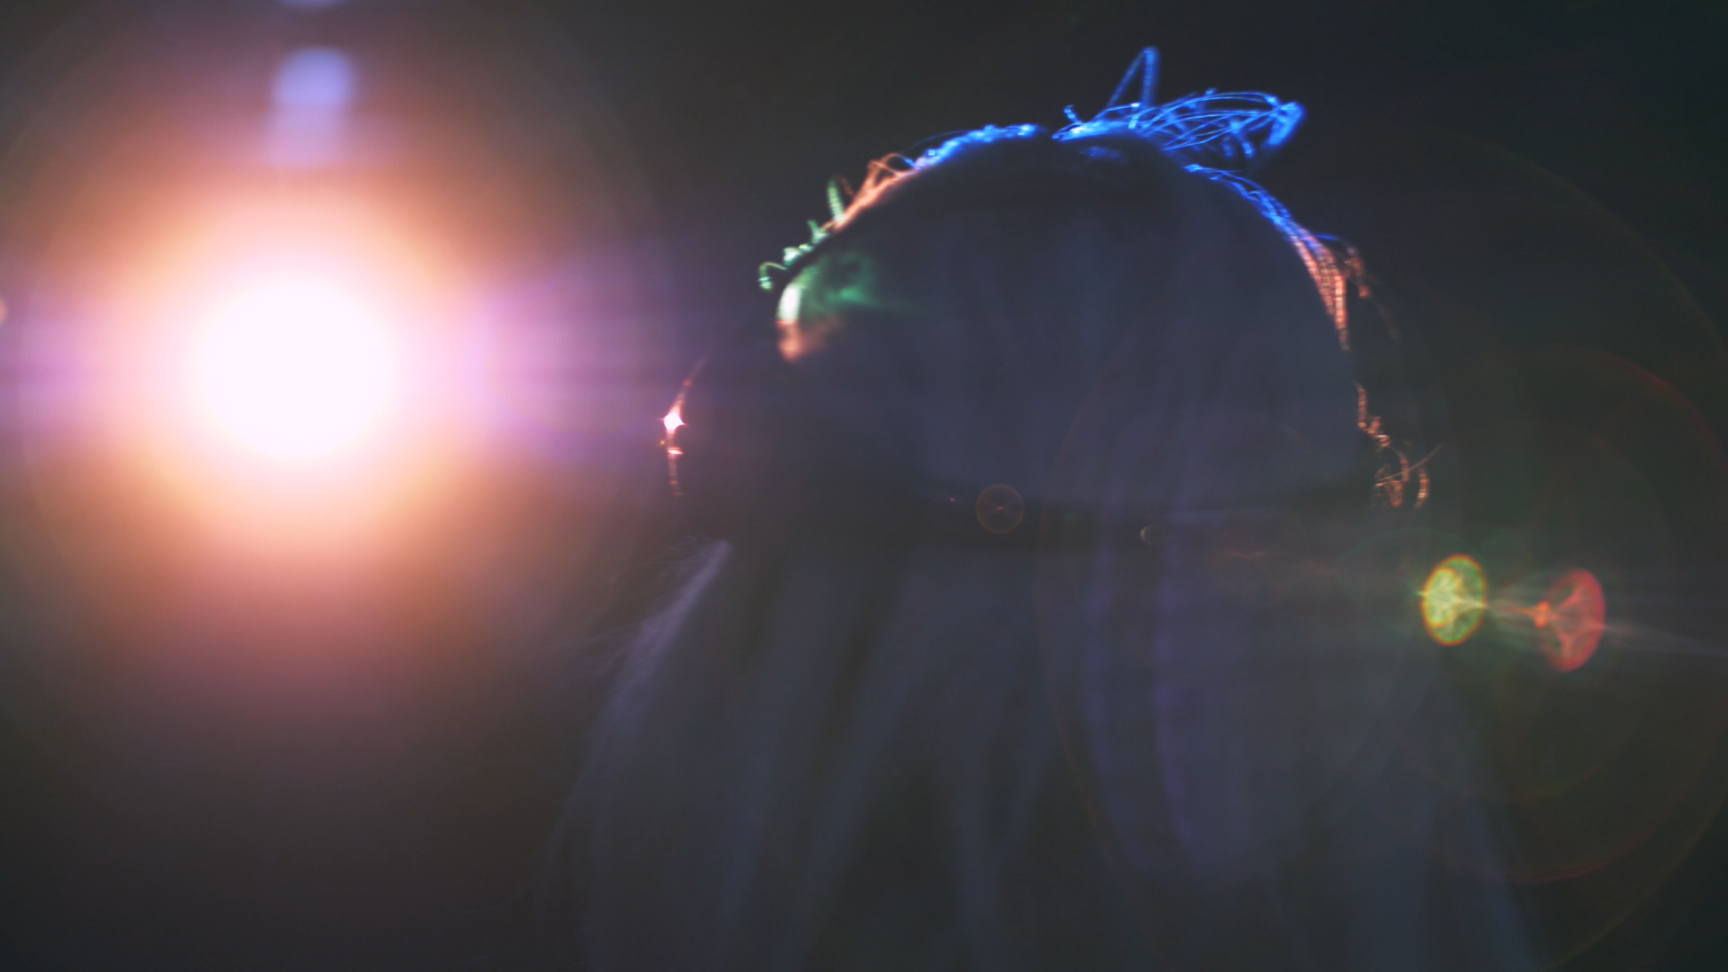
EMOTIV Insight EEG Headset
An Electroencephalography device is a machine that detects electrical activity in the brain using small electrodes placed on the scalp. Cells in the brain communicate via electrical impulses which produce voltage fluctuations resulting from ionic current within the neurons of the brain. For this project, I used a commercially available EEG named Insight, produced by EMOTIV. It is a relatively low cost consumer device that allowed for me to capture and transmit the data I needed for this visualization. The EEG can detect these changes and displays them on a graph as typically wavy lines or numerically in a datasheet.
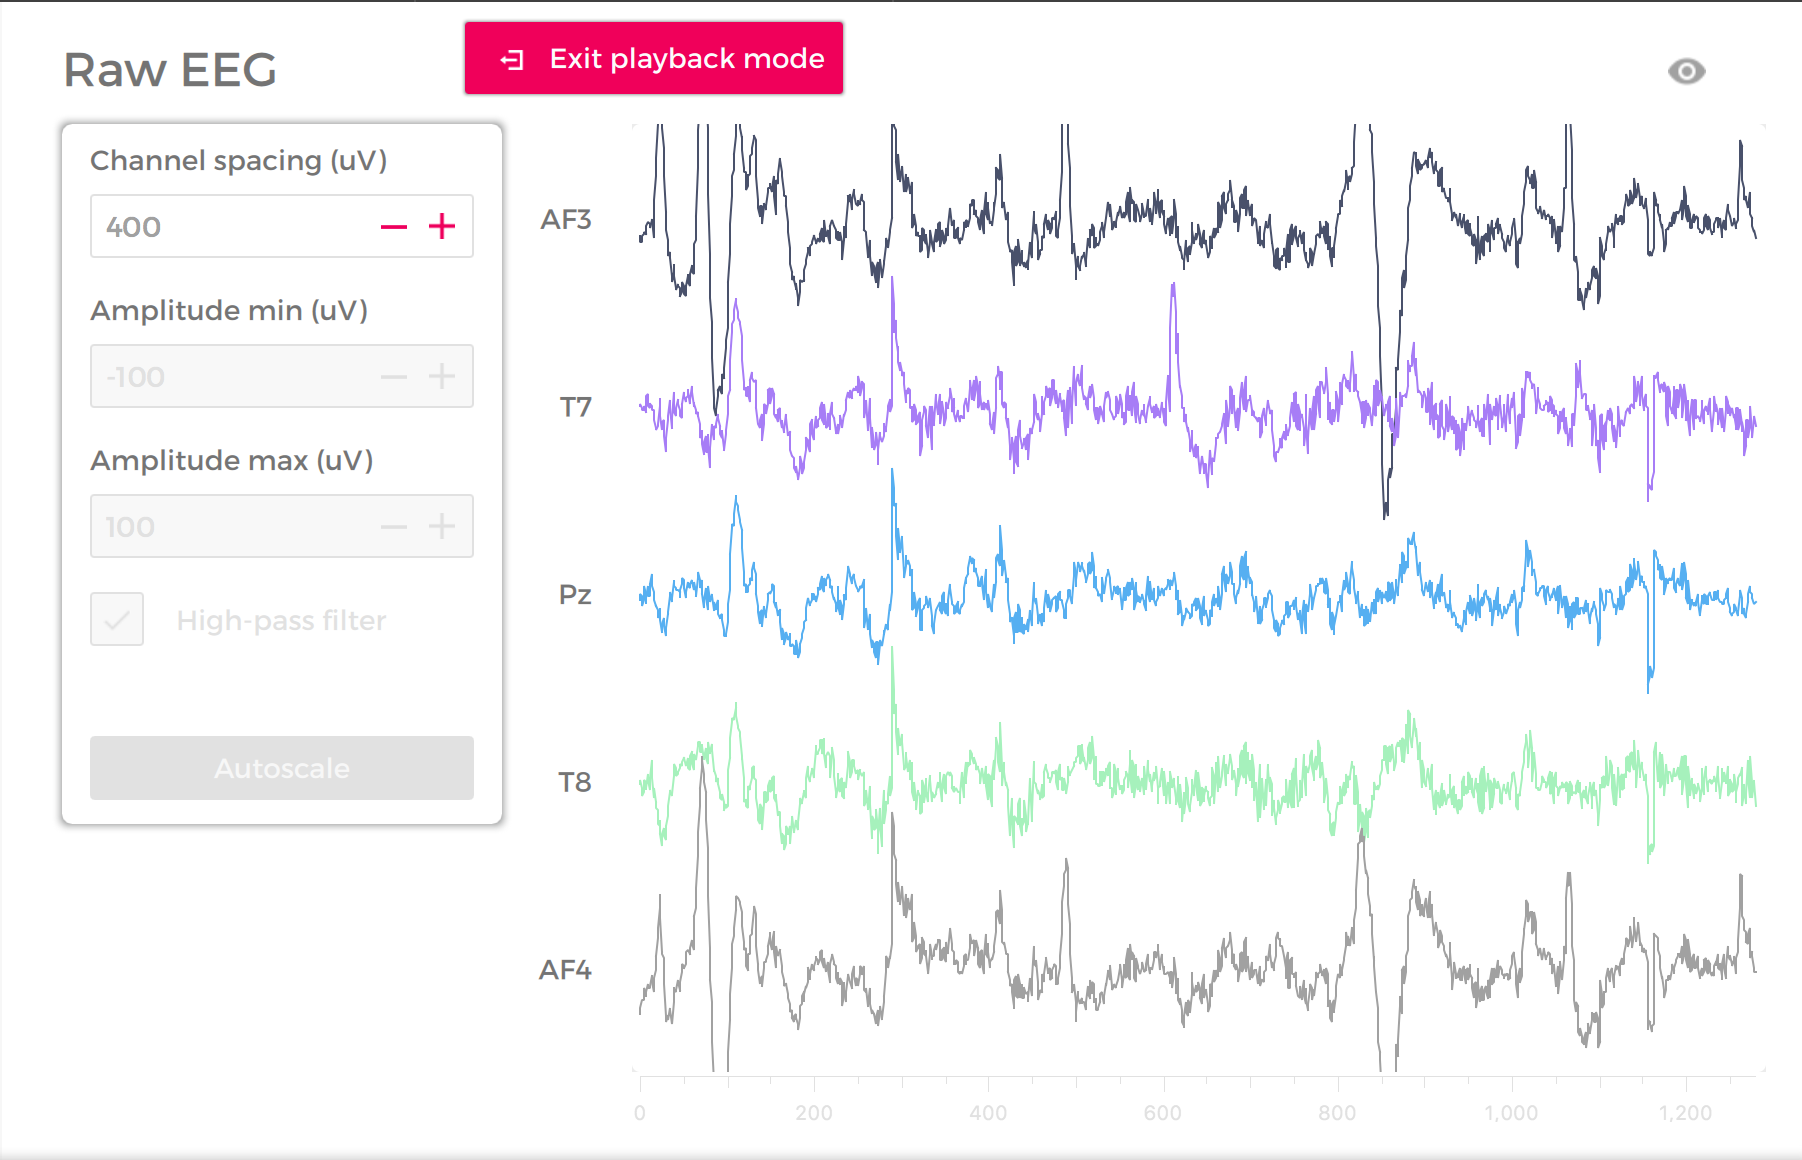
Raw EEG data from a recording on EMOTIV PRO
Each line on the graph is a measurement of each electrode in the EEG. Within those lines, valuable information can be determined about the brain waves that are being produced by the brain. Different frequencies of brain waves indicate different states that the mind is in or what the person is doing at the moment of the reading.
Brainwaves Explained

There are five main types of brain waves, Alpha, Beta, Delta, Gamma and Theta. Each one have been show to be indicators of certain distinct brain states. Here's a quick summary of the brain waves and what they represent:
Alpha (7.5-14Hz) — The Deep Relaxation Wave
Beta (14-40Hz) — The Waking Consciousness & Reasoning Wave
Delta (0.5-4Hz) — The Deep Sleep Wave
Gamma (above 40Hz) – The Insight Wave
Theta (4-7.5Hz) — The Light Meditation & Sleeping Wave
For this project, I wanted to focus on Alpha and Beta brain waves in particular. The presence of Alpha waves is typically associated with reflection and meditation, while Beta waves are an indicator or arousal and being actively engaged in mental activities.
Process

My early research for this project focused on what types of applications of EEG technology existed right now. The two that intrigued me most were projects done by Joshua Carr and Lisa Park. Josh is an engineer at IBM who created a program to control a Sphero BB-8 using the Emotiv Insight headset, while Lisa is a performance artist in New York who created the Eunoia I and II projects.
Both of these projects showed me that the data from these EEG devices could be utilized in a variety of different applications. There are projects to control drones, to help people without limbs create art, control prosthesis, and so many more. The projects that really resonated with me however, were the ones that focused on emotions and visualizing the complexities of the human mind.
Over the summer, I begun teaching myself Max/Jitter by Cycling 74 to understand how I can create a visual, immersive atmosphere based on the data from an EEG headset. I did this by watching tutorial videos online and attempting to recreate some examples of other peoples work.
Once I understood how to use the EEG and manipulate the data in Max, it was time to start forming the final visualization.
First, I needed to figure out how to create the atmosphere that I wanted for the visualization. After playing around in Max, I discovered the ability to create particles that had their own mass, velocity, and acceleration properties.
The first system I created above became a good starting point for the rest of the visualization. Creating a particle system of 400,000 points falling at a rate consistent with Earth gravity allowed me to begin getting creative in the ways they could be manipulated. Doing some research, I then figured out how I could mimic a strong gravitational field based on the position of the mouse in the frame. The gravitational field would attract the particles closest to its center of mass more strongly than particles further away.
Combining the particles and the ability manipulate their positions allowed me to further explore how to implement my EEG data into the visualization. Since the mouse position is interpreted by Max as a series of decimal values, I realized I could substitute those values with EEG data points achieving the manipulation of particles with EEG data.
Testing various data sets with the visualization, I decided that the most meaningful and interesting data to use would be High/Low Alpha data as the position determinant and High/Low Beta data as the color.
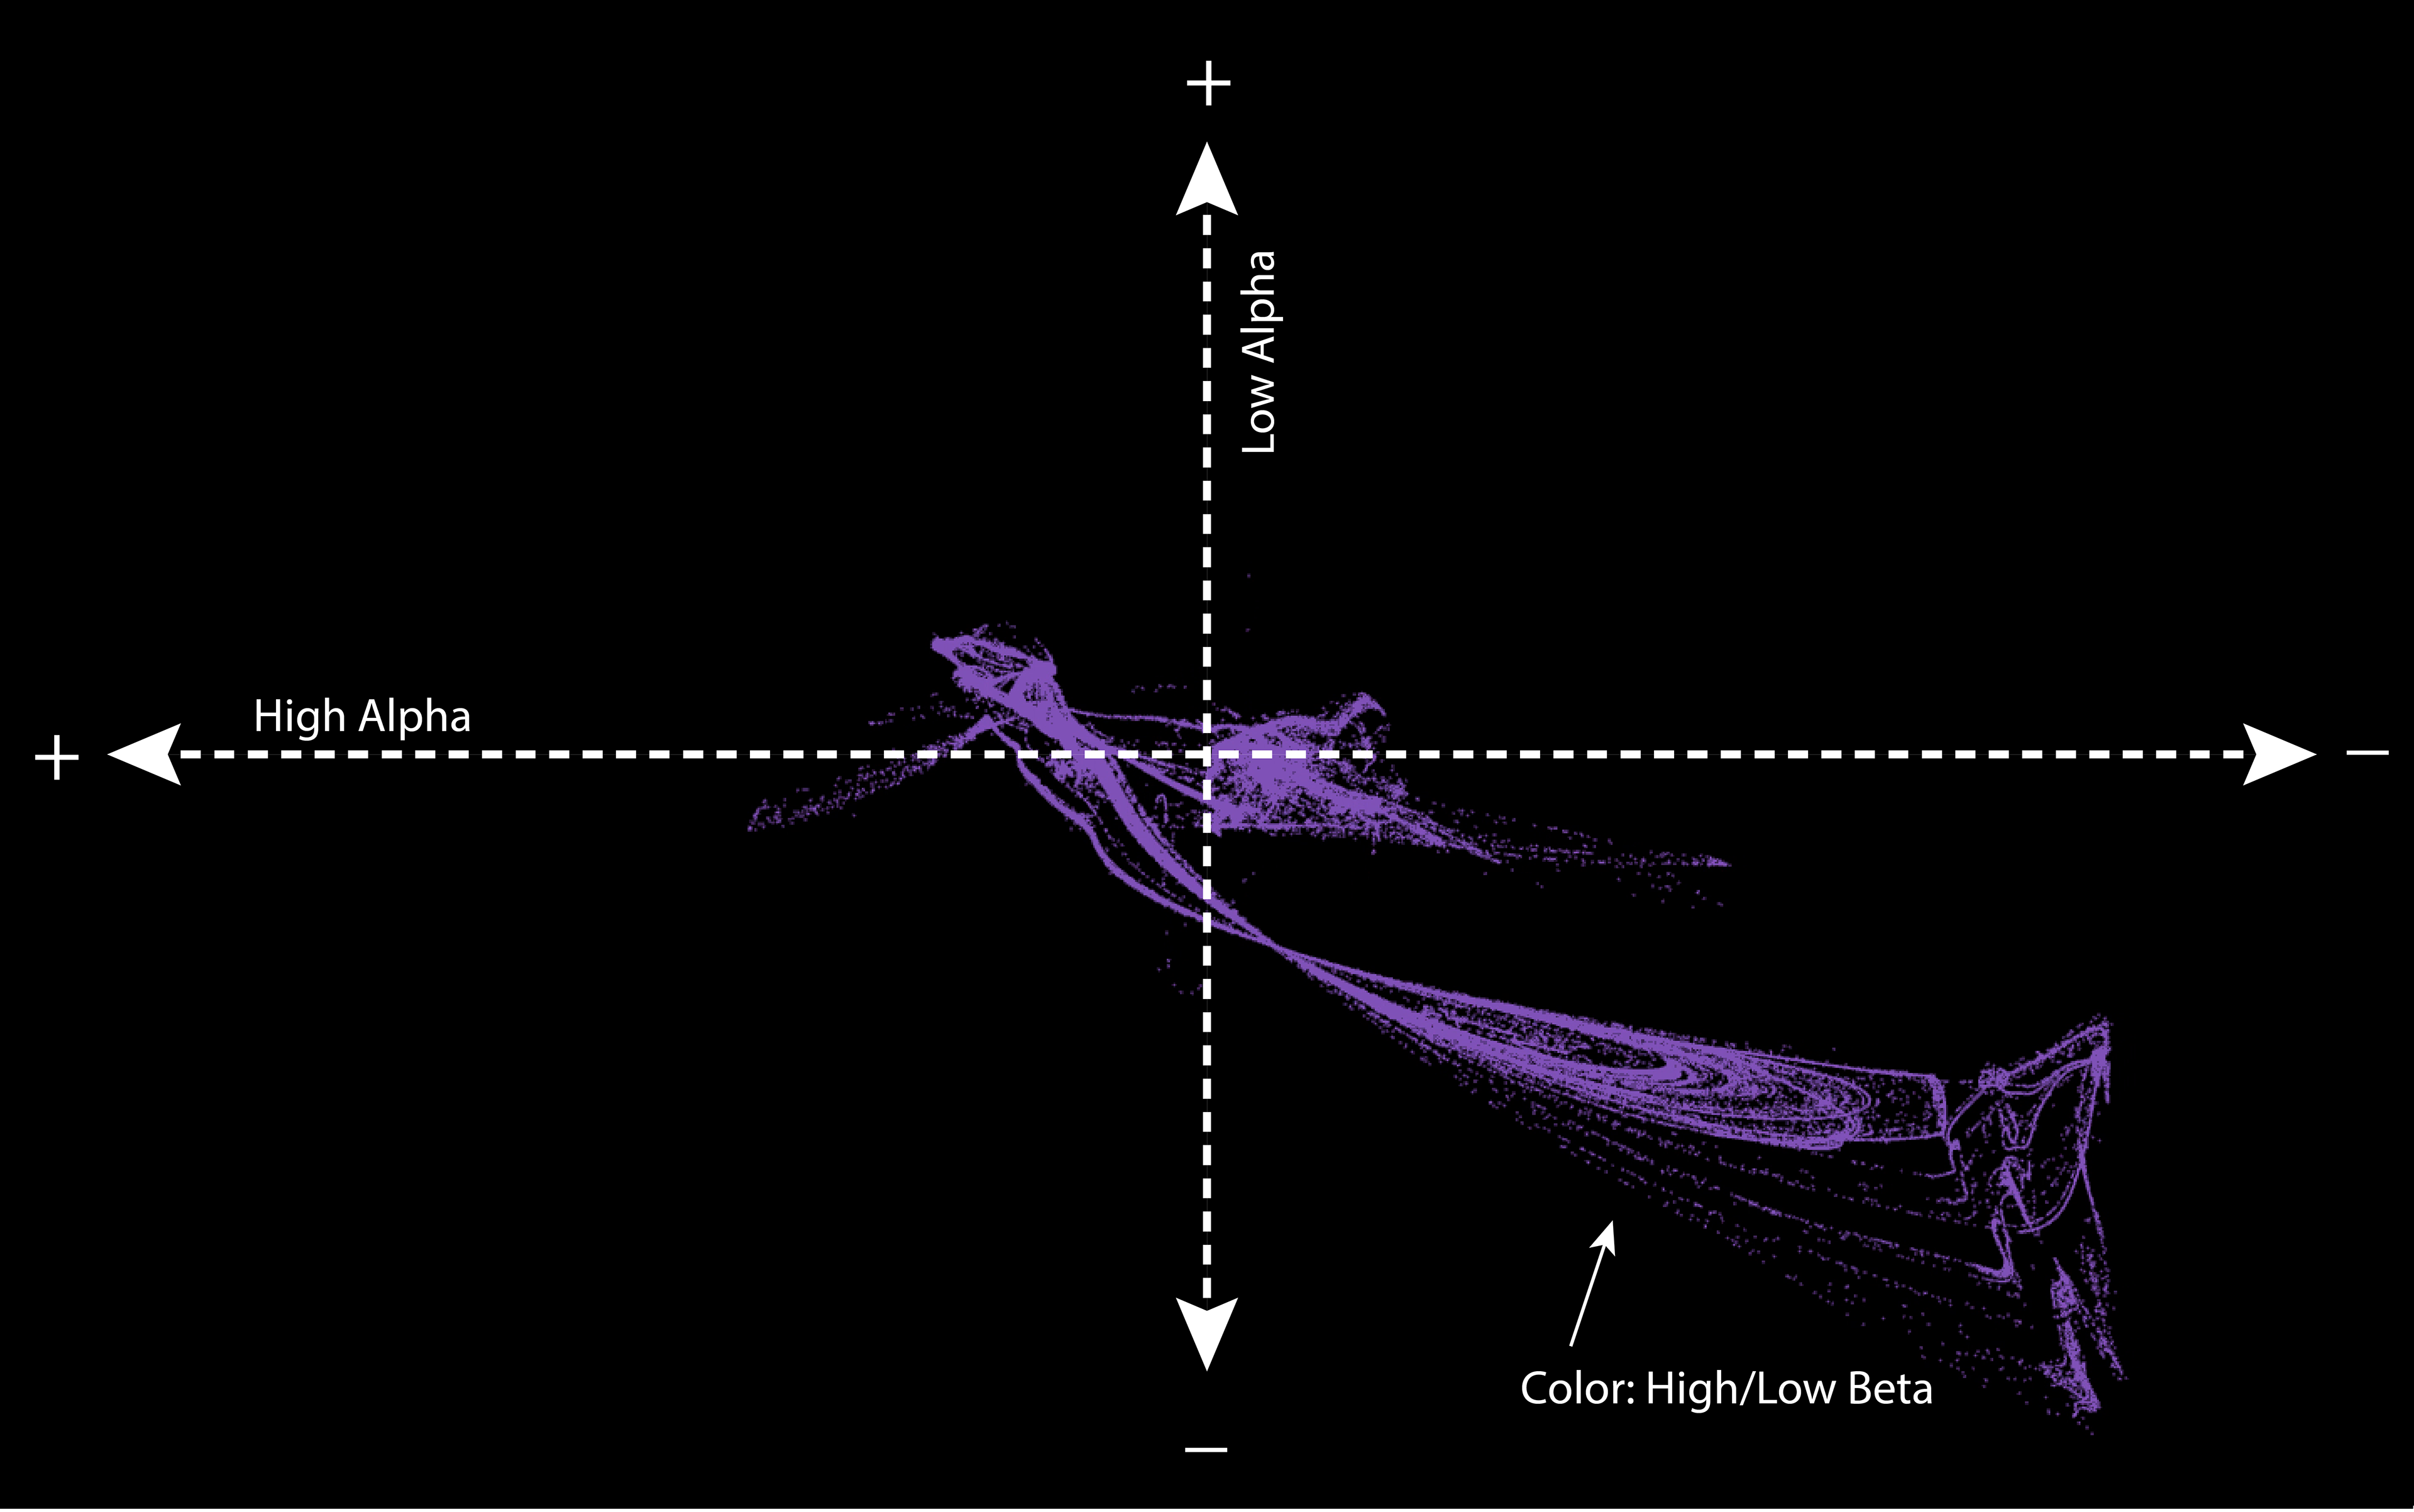
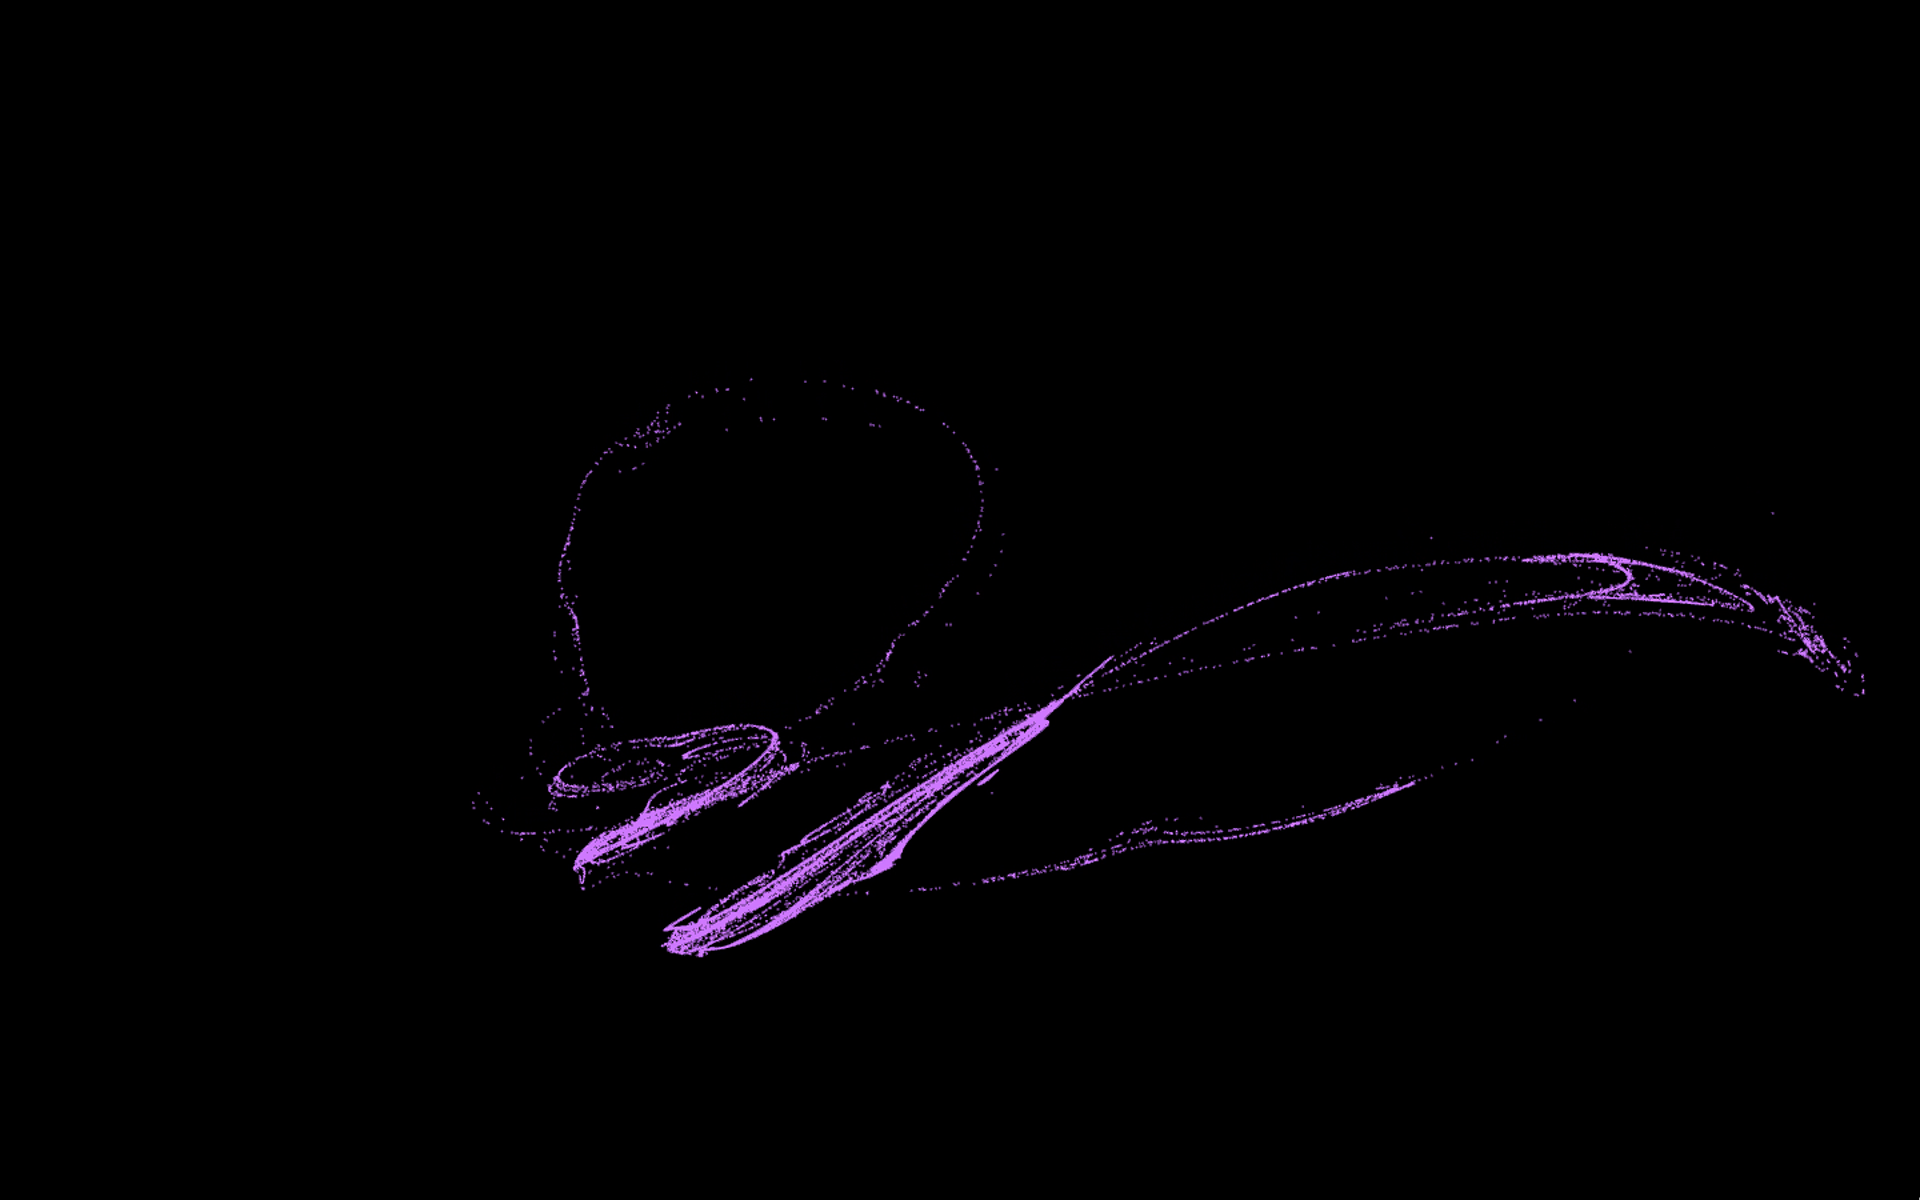
Visual explanation of the particle movement and color change
Both sets values needed to be scaled in order for them to fit within the window constraints of the visual. Alpha waves were scaled so that fluctuations in the voltage changes were more pronounced in the visual.
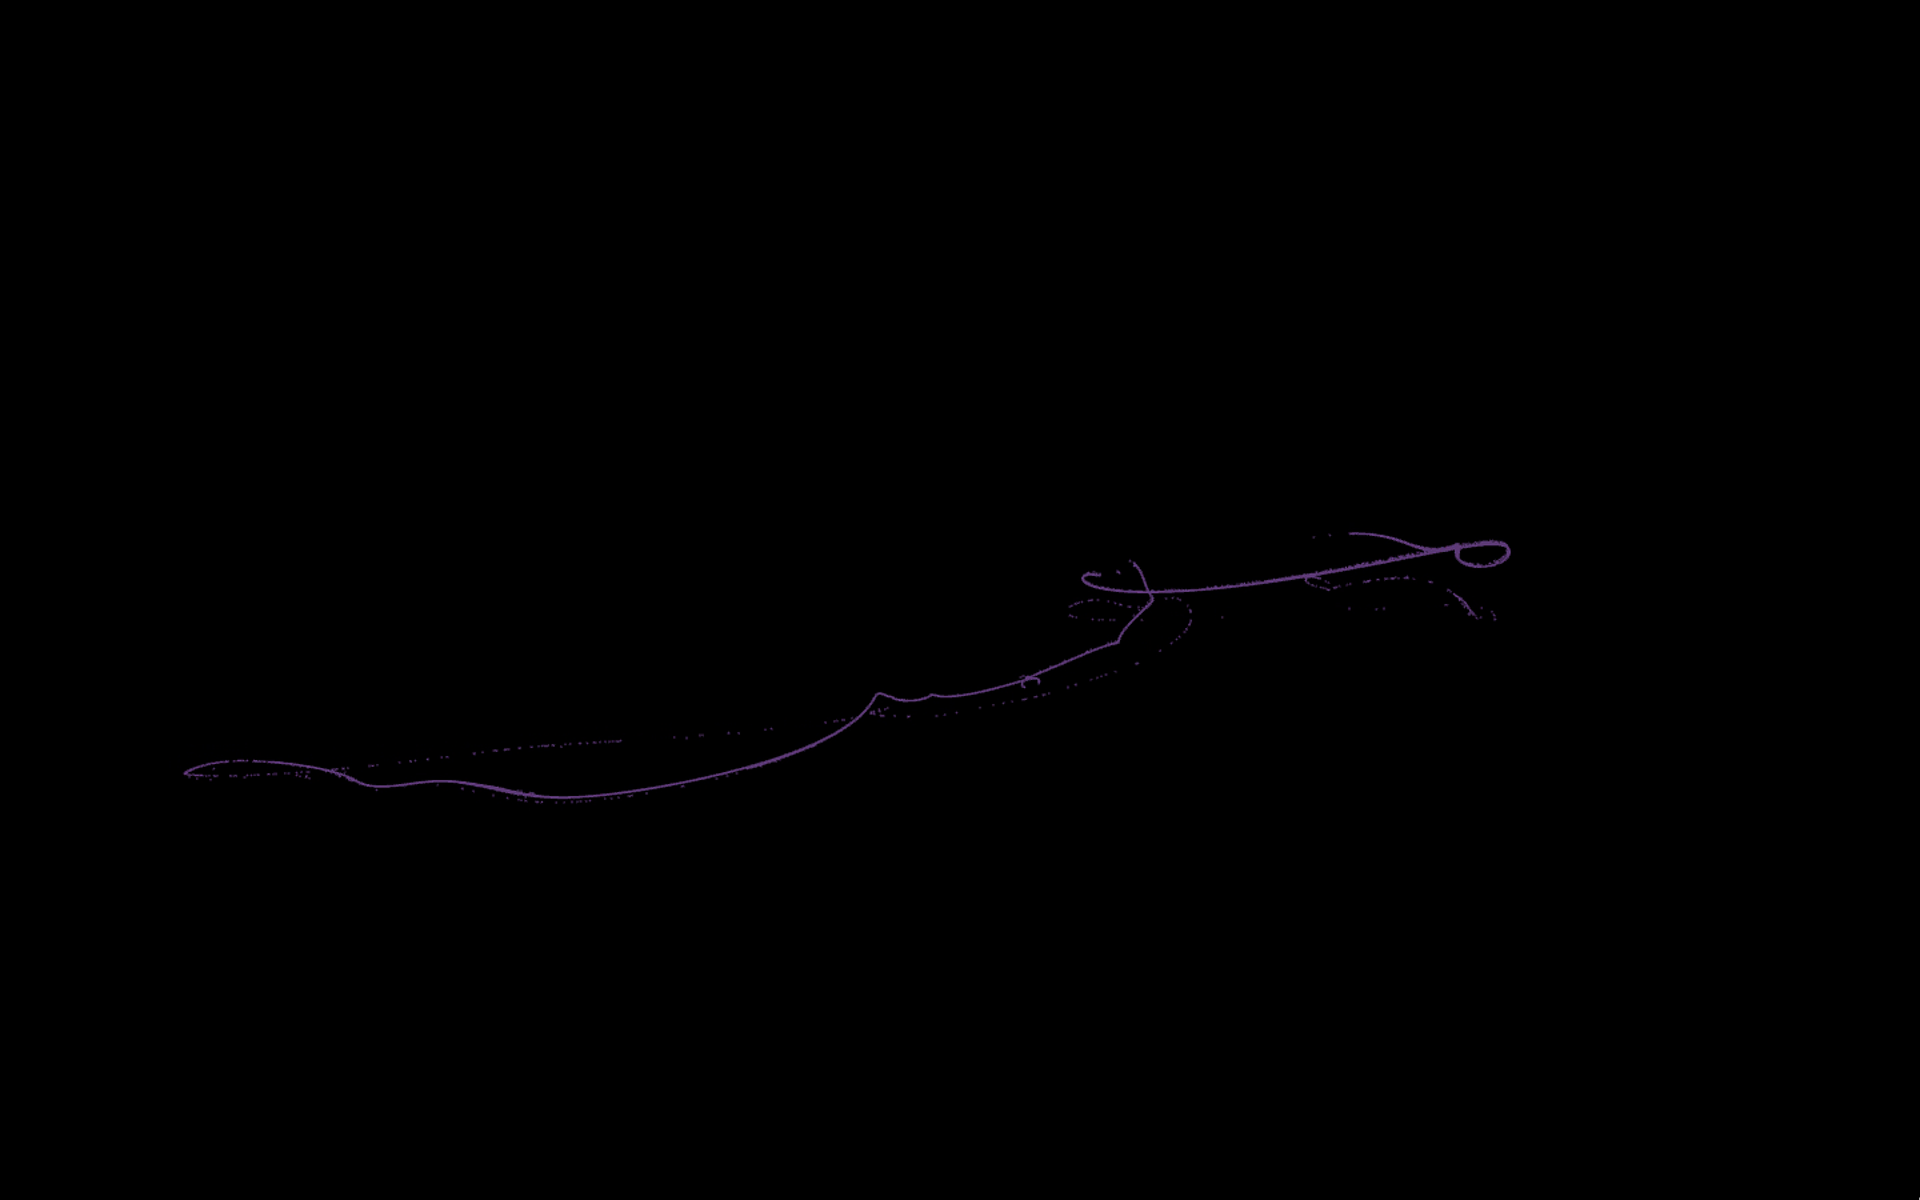
In the video above you can see at the beginning that all the particles fall to the bottom. This is because there is very little Alpha activity in the subject's mind, creating a lack of a gravitational field to manipulate the particles.
Imagination the invisible gravitational field as a changing set of X and Y coordinates. When there are higher levels of high Alpha waves, the gravitational field shifts to the left on the X axis. Similarly, when the high Alpha values are lower, it shifts right on the X axis. The same applied for low Alpha with higher values shifting the Y coordinate upward, and lower values shifting it downward. Together, these changing values move all around the coordinate plane, creating change in the particle movement.
The Beta waves not only needed to be scaled but also inverted. Since they were less prevalent during meditation (as expected) and therefore the inversion was created so when there was a lack of Beta, color was more pronounced in the particles. A lack of Beta represents a mind more at ease and relaxed.
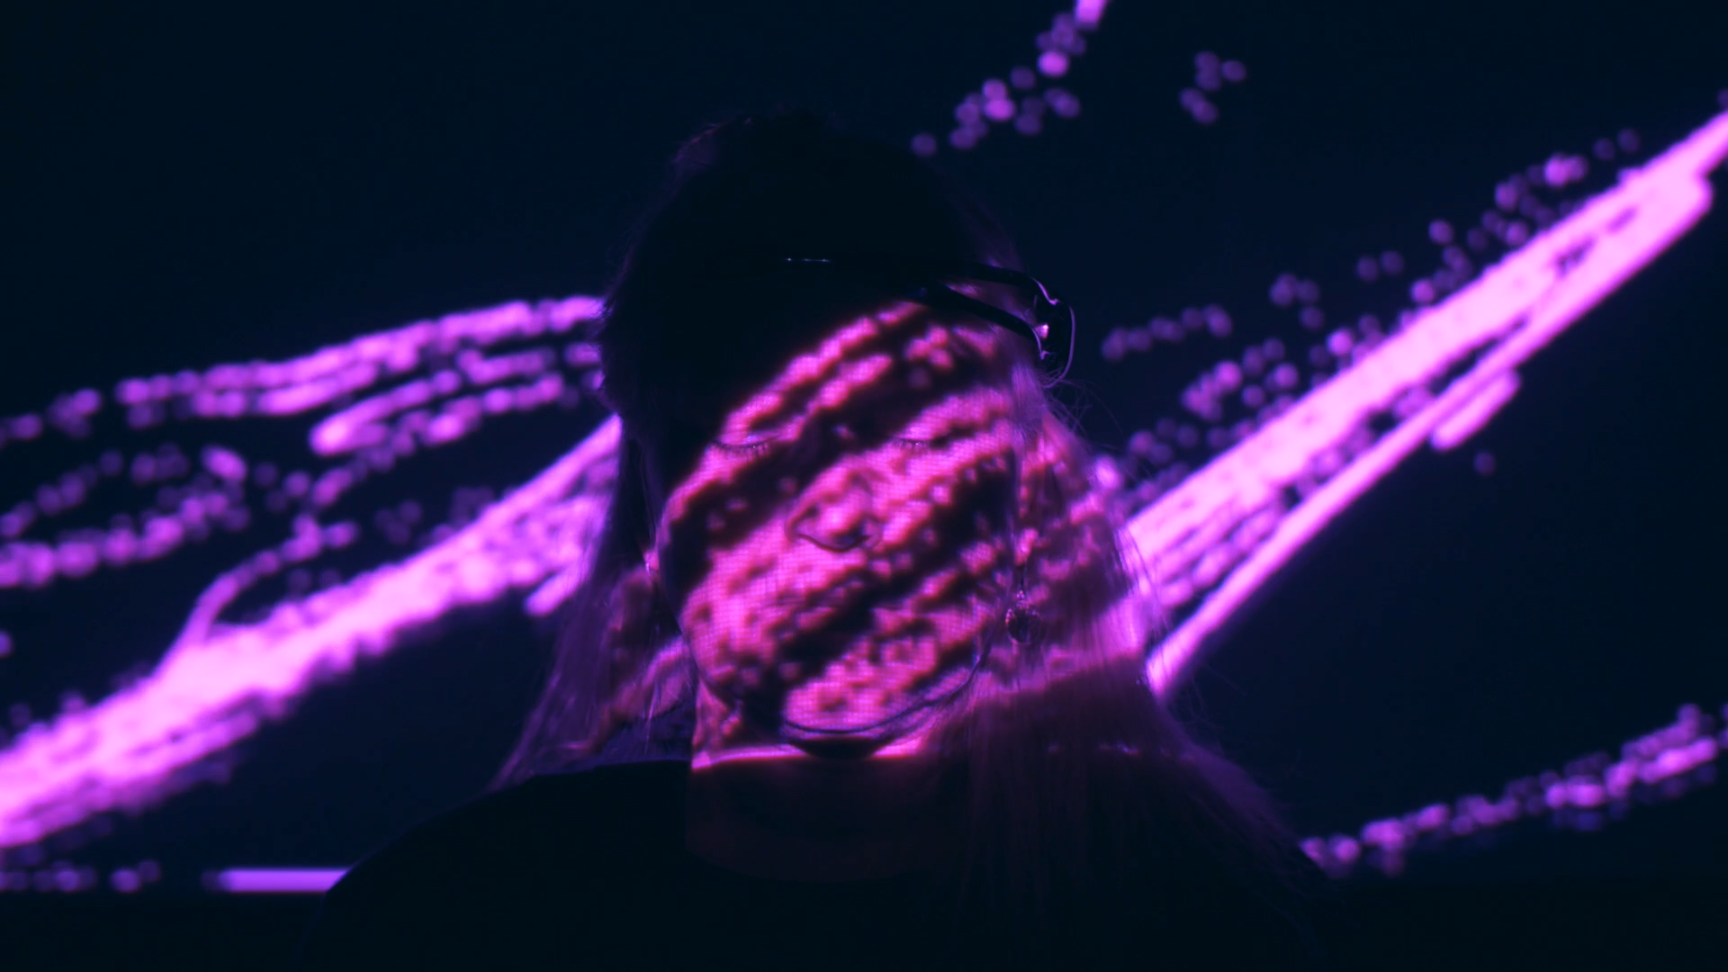
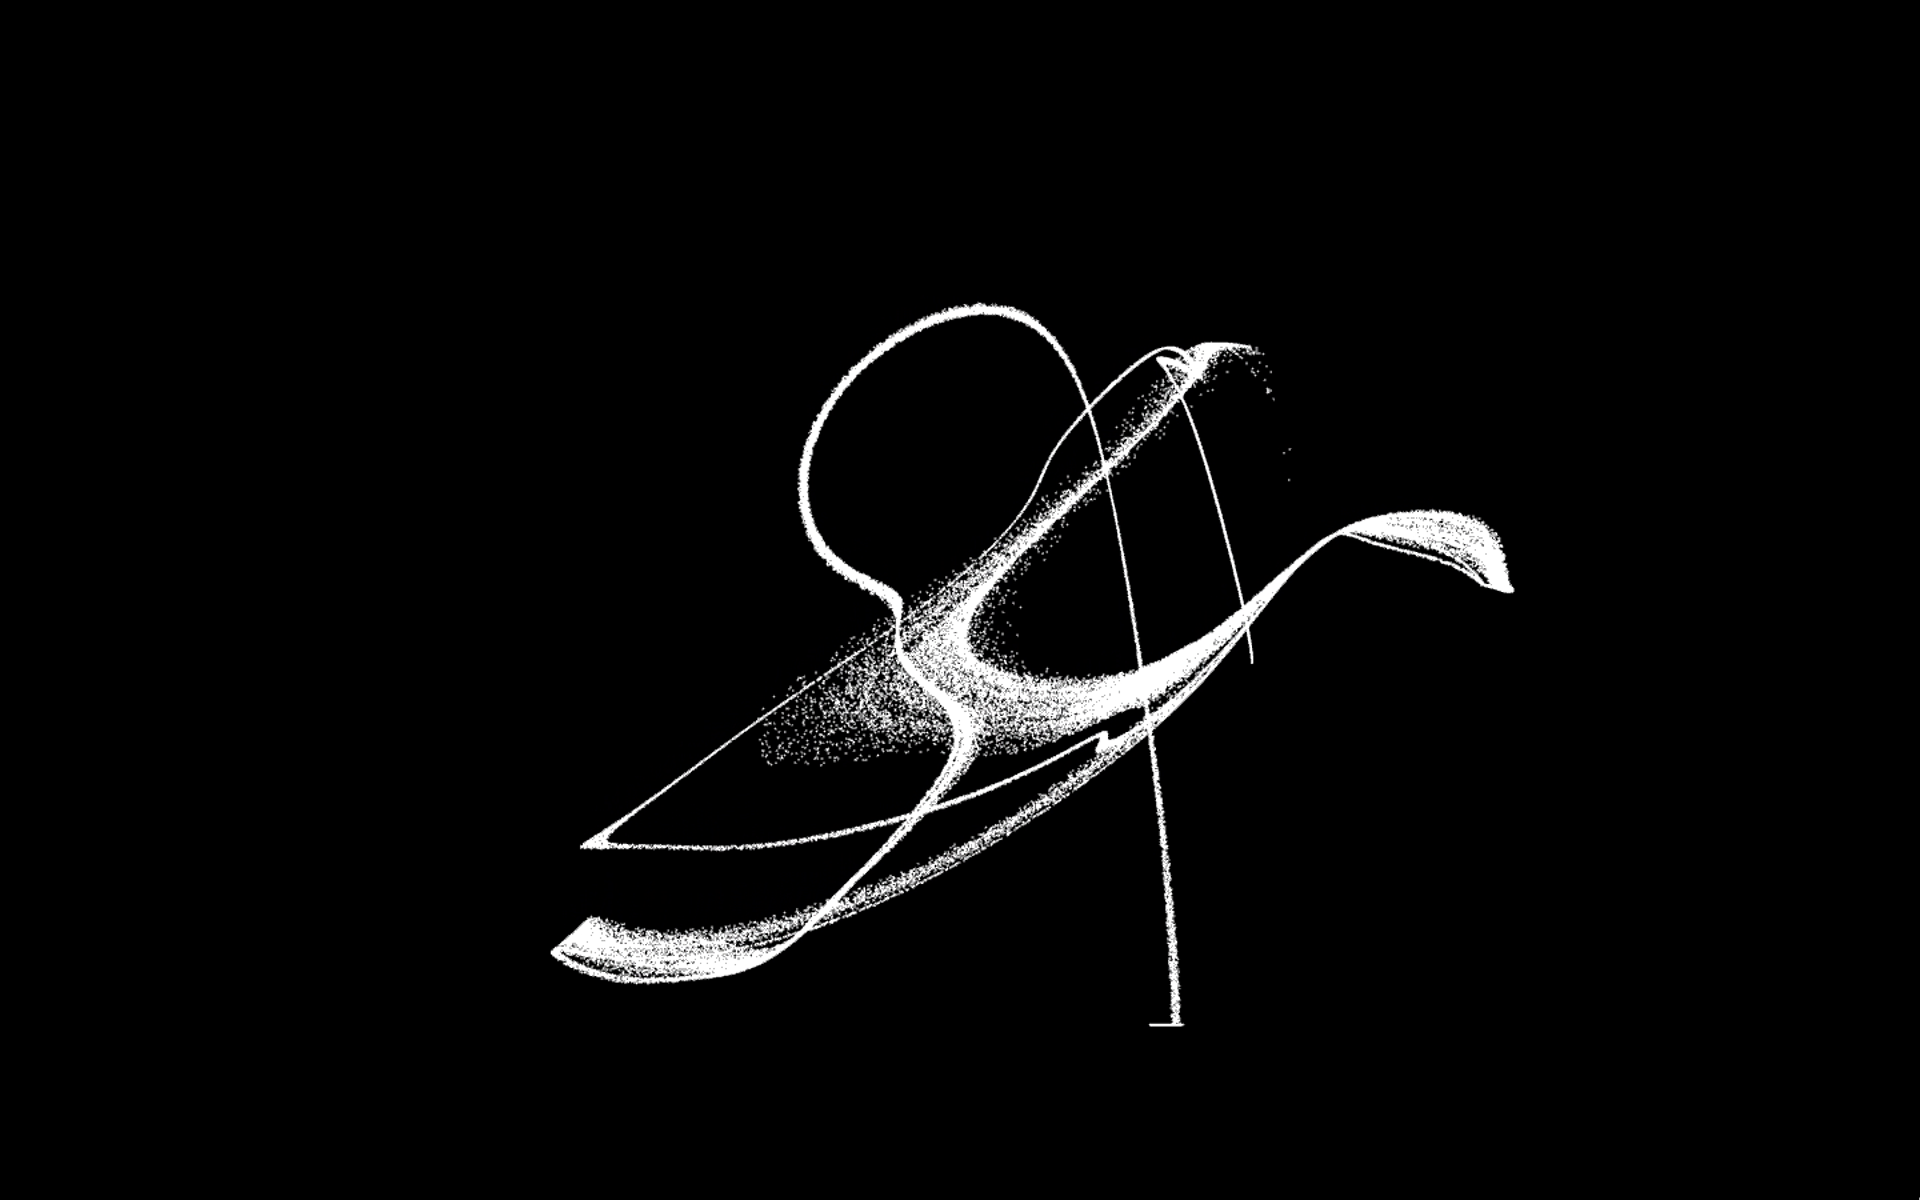
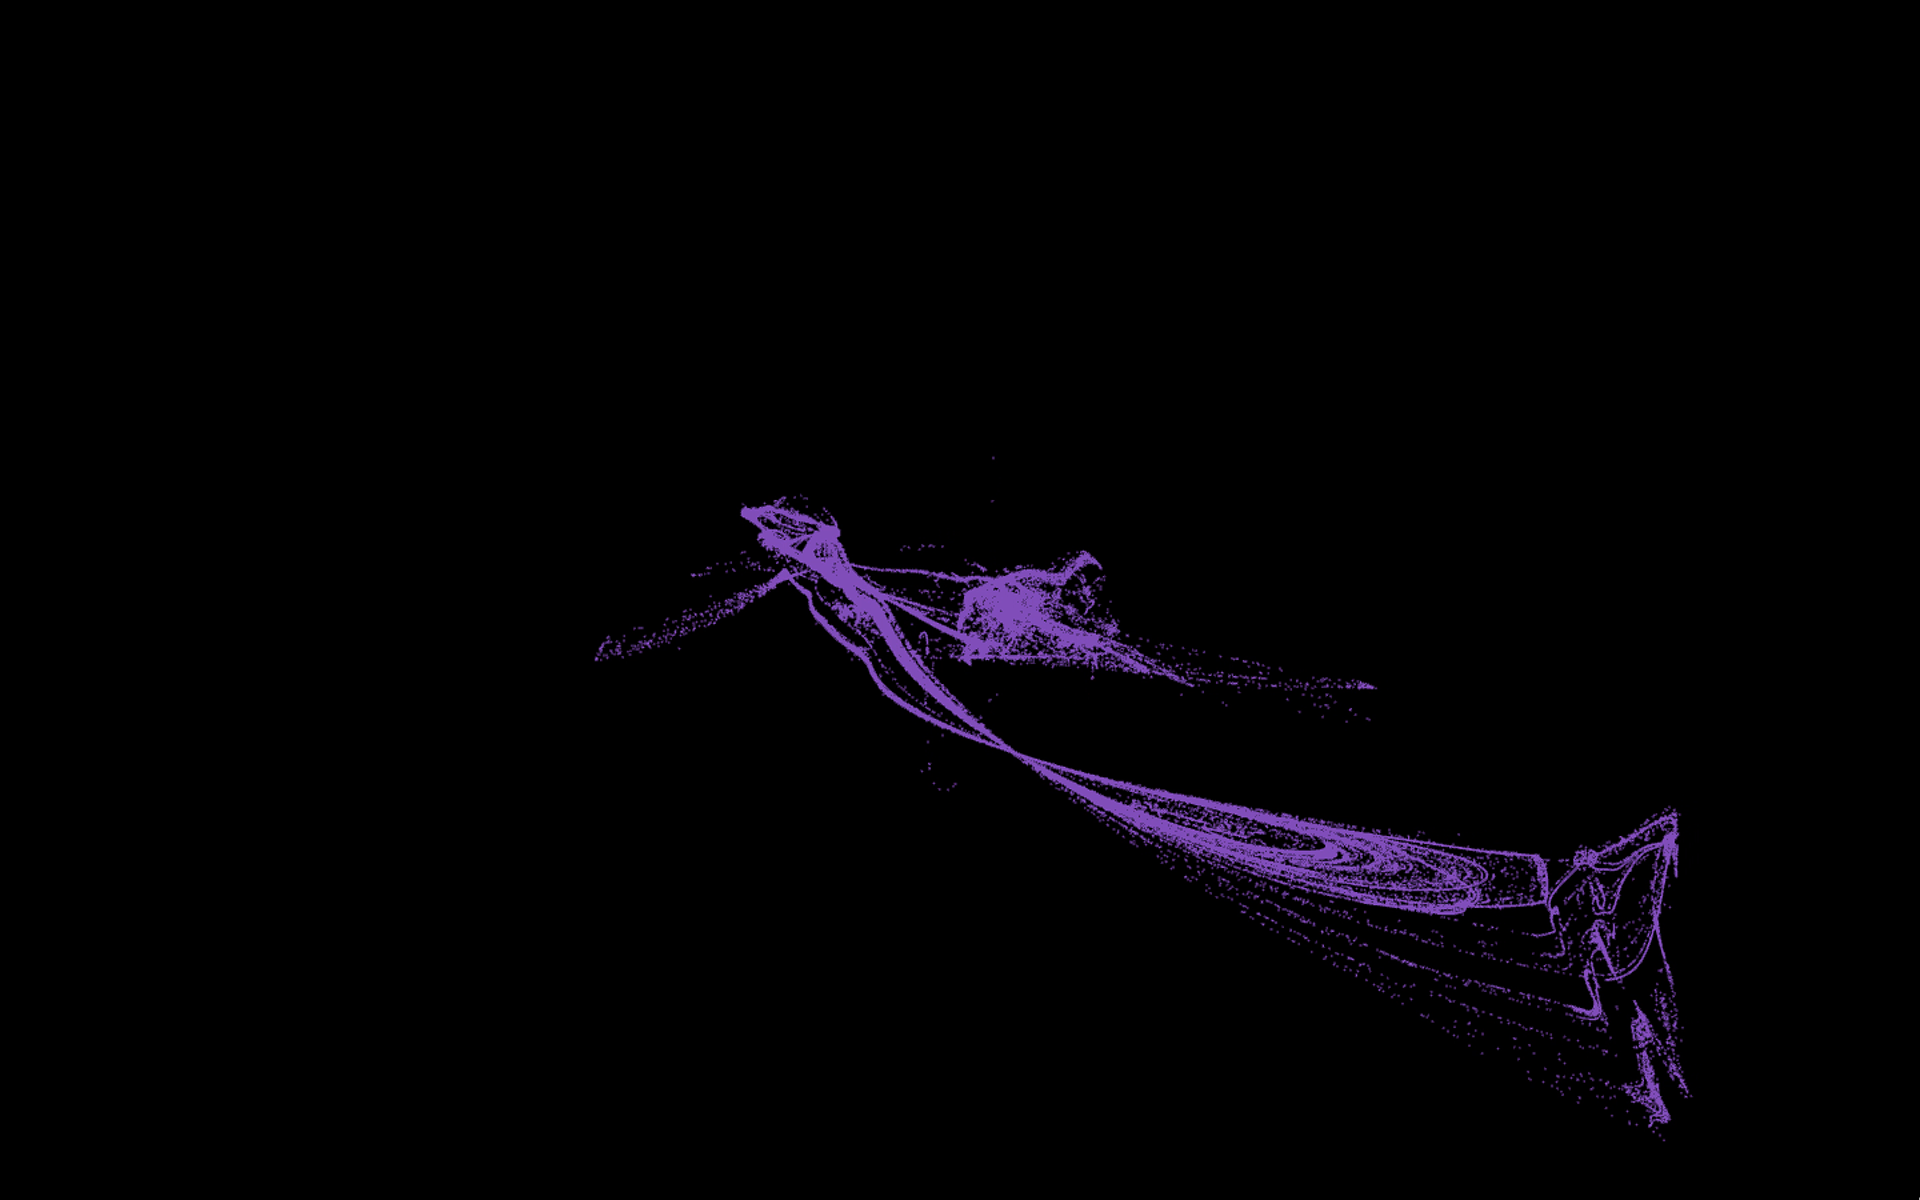
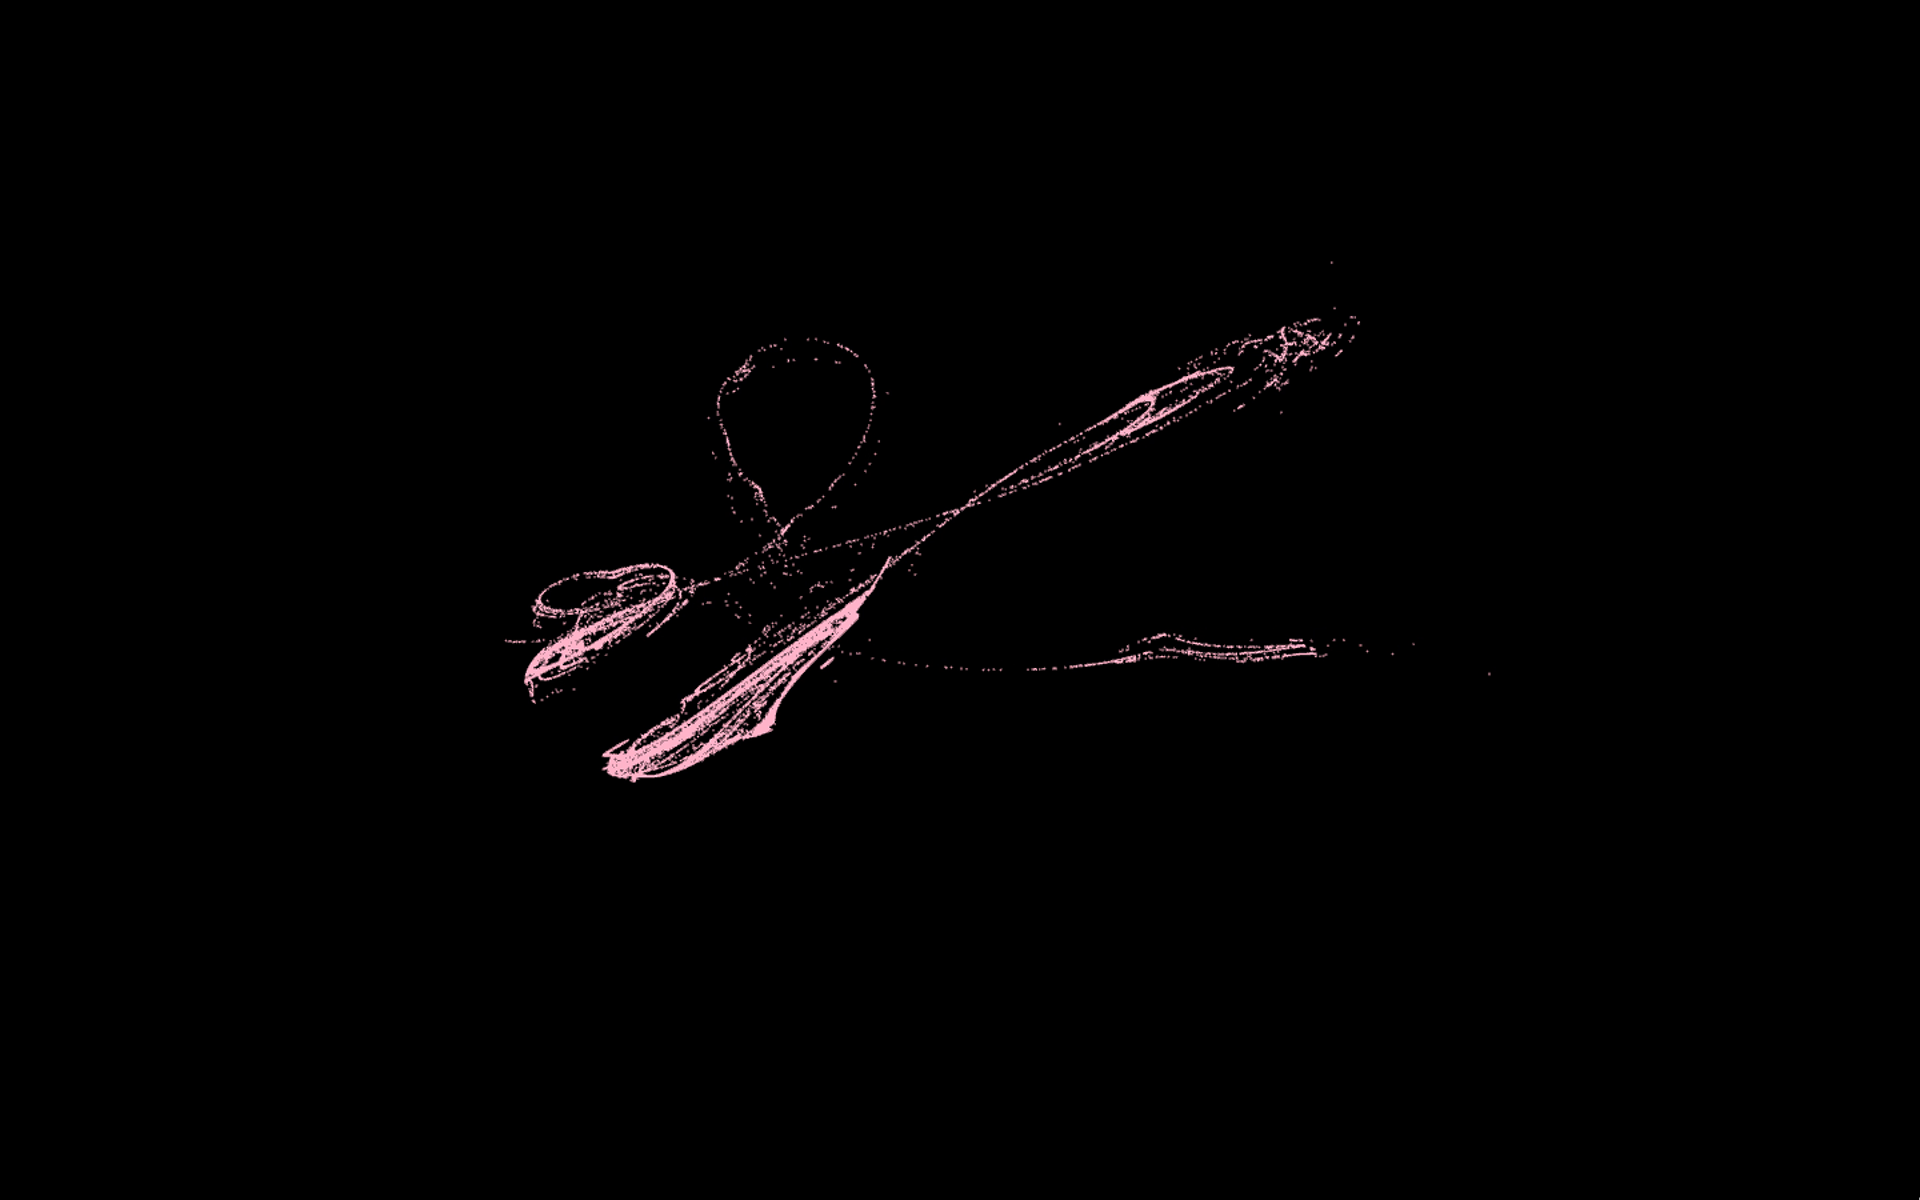
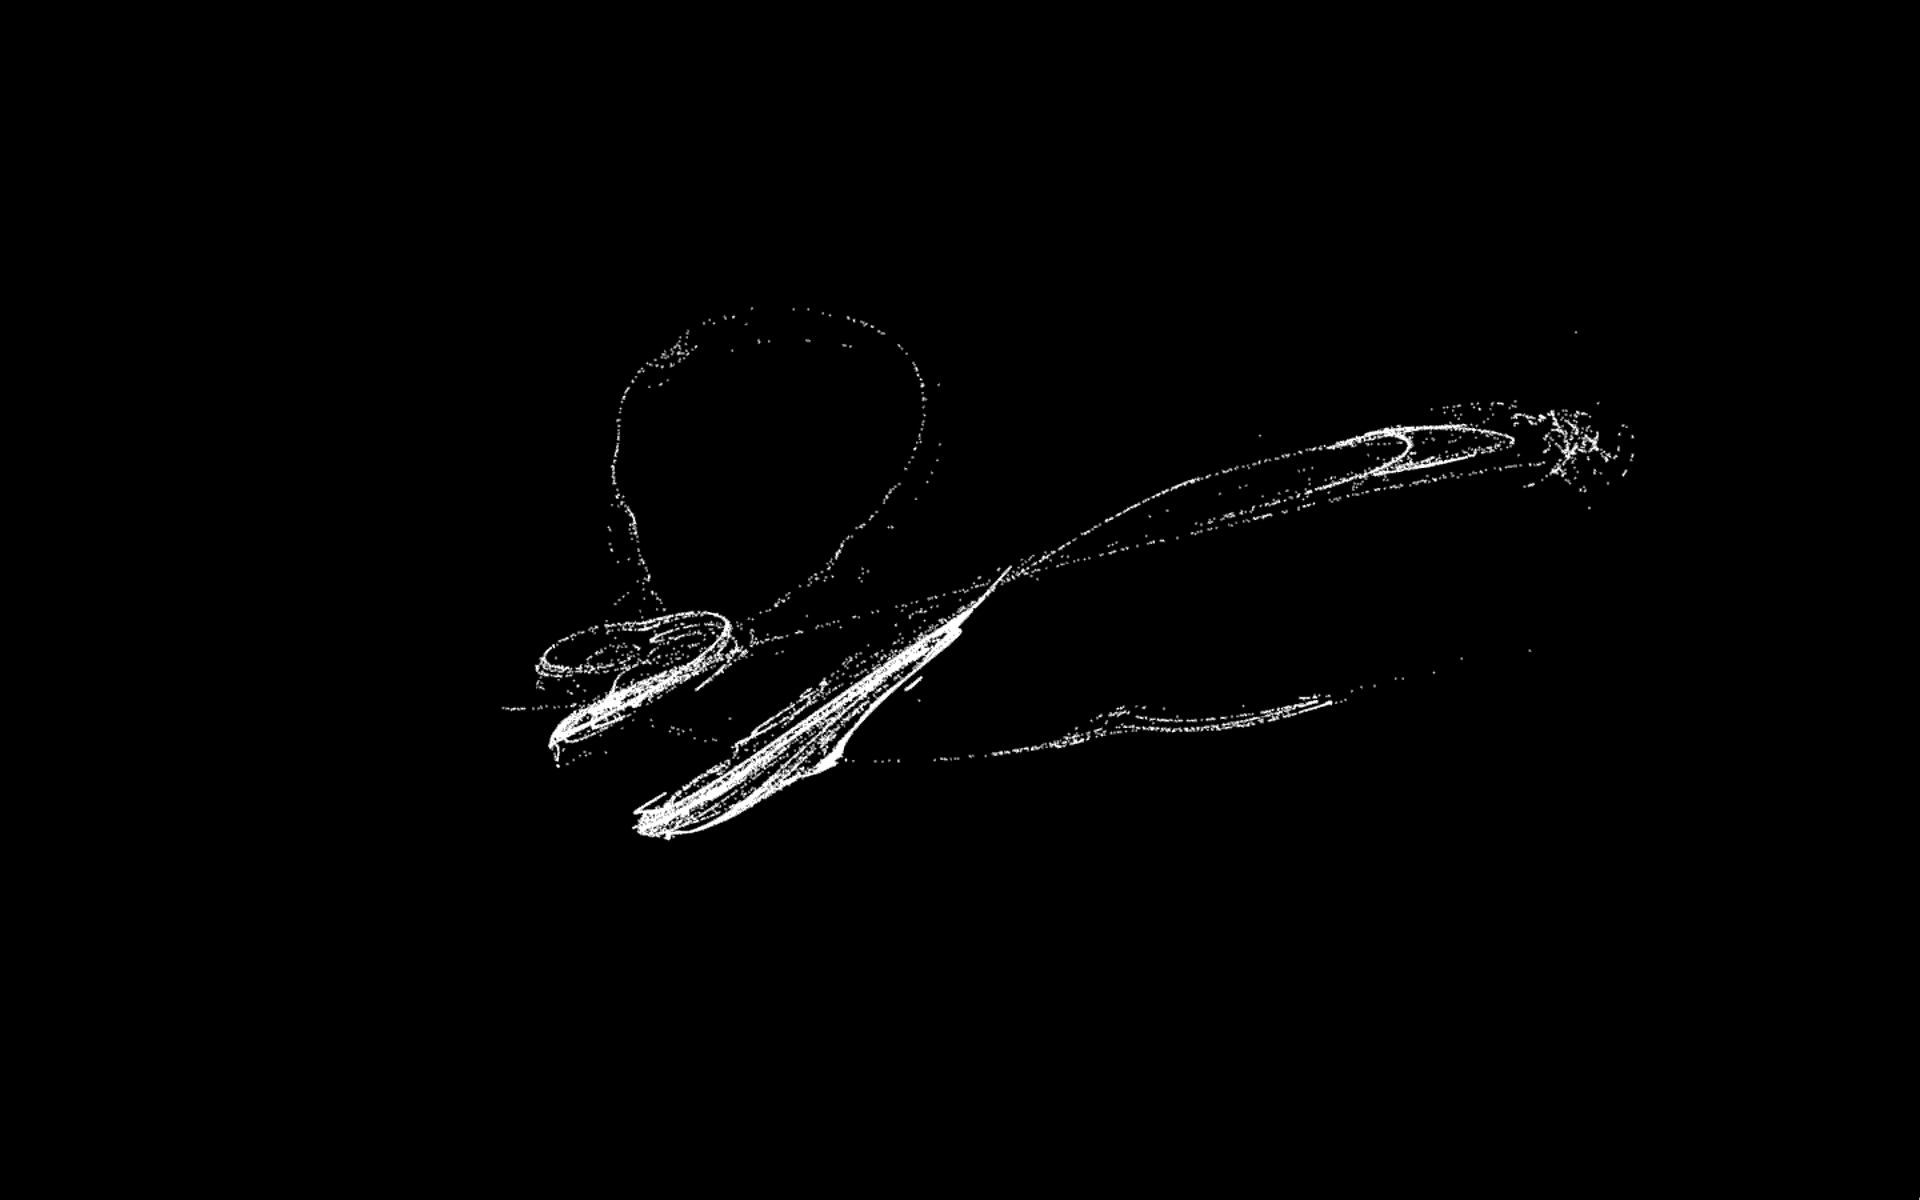
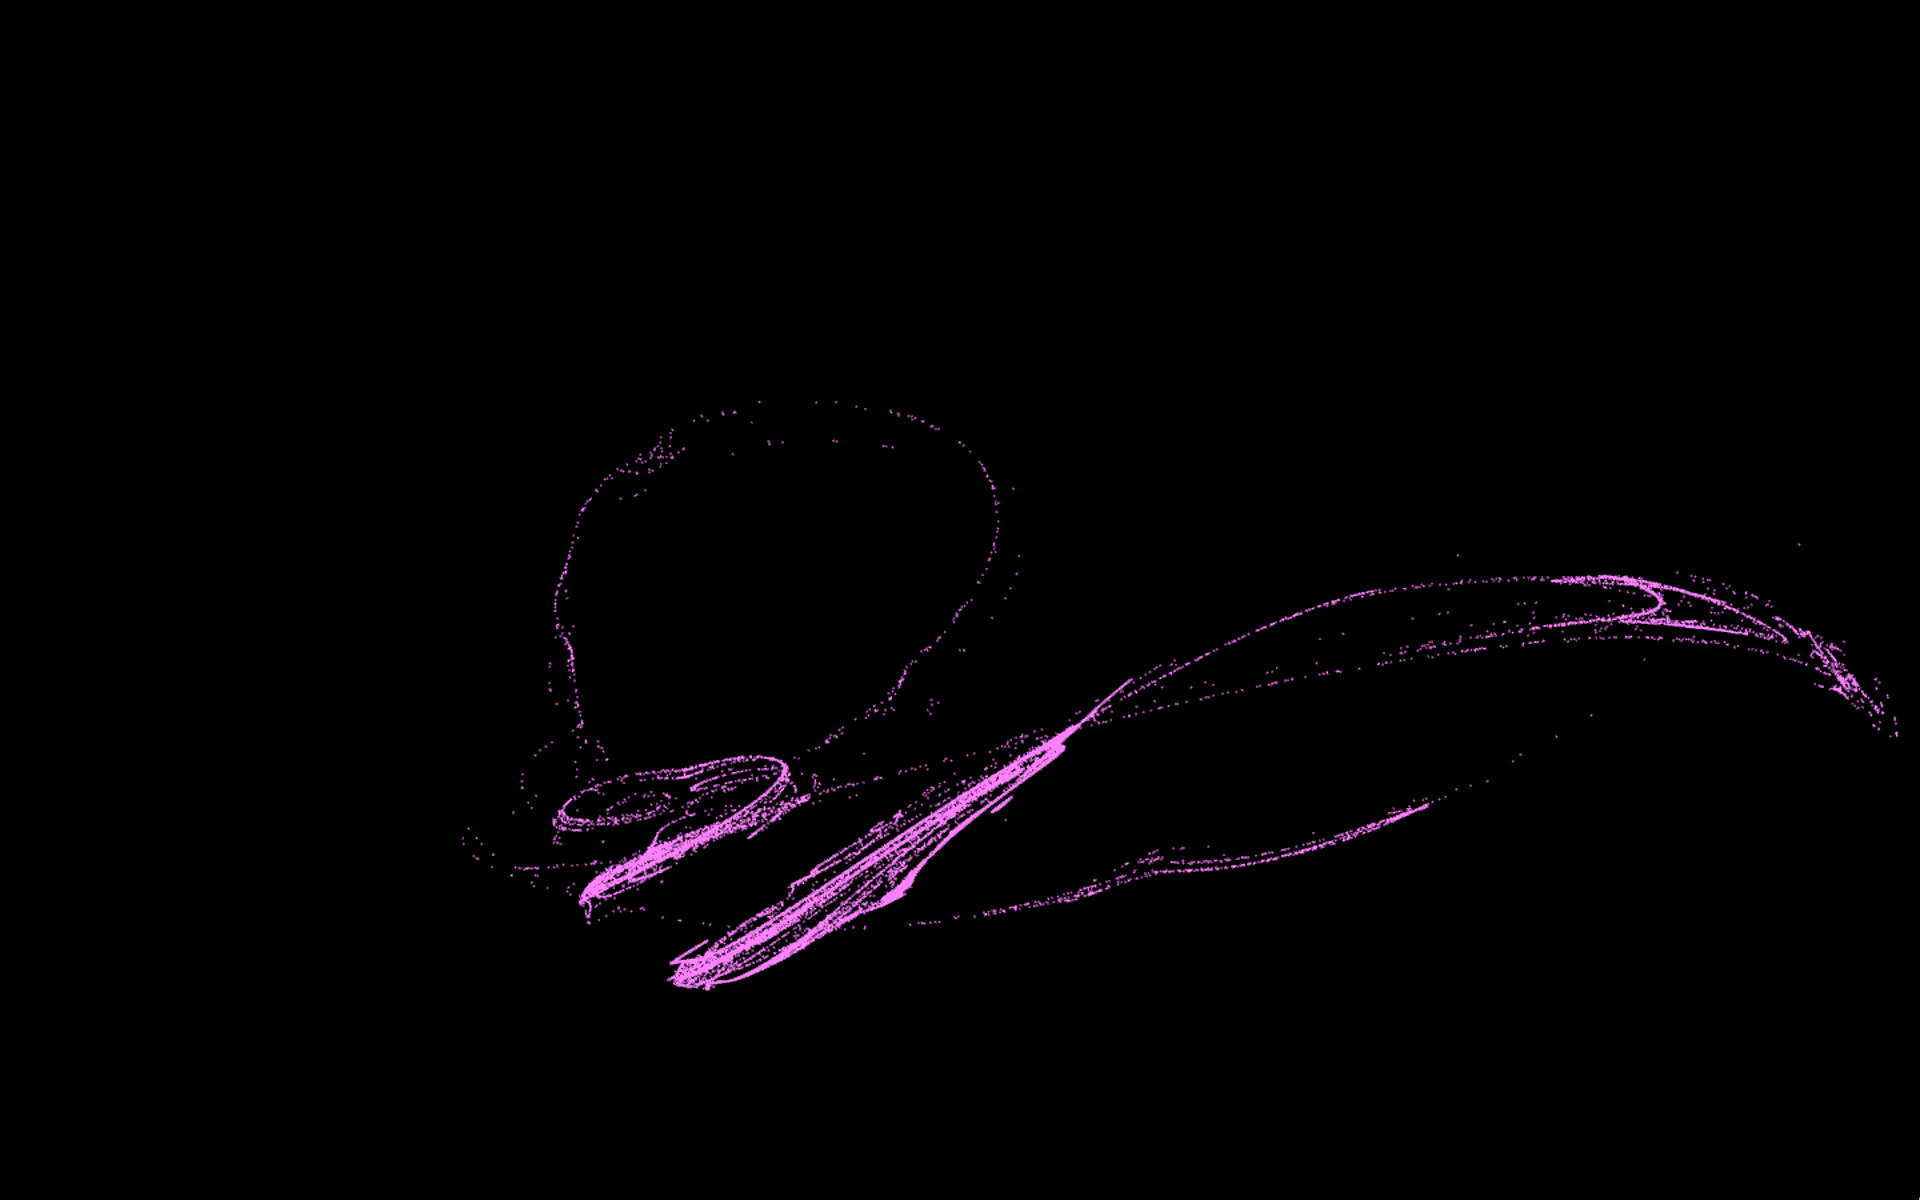
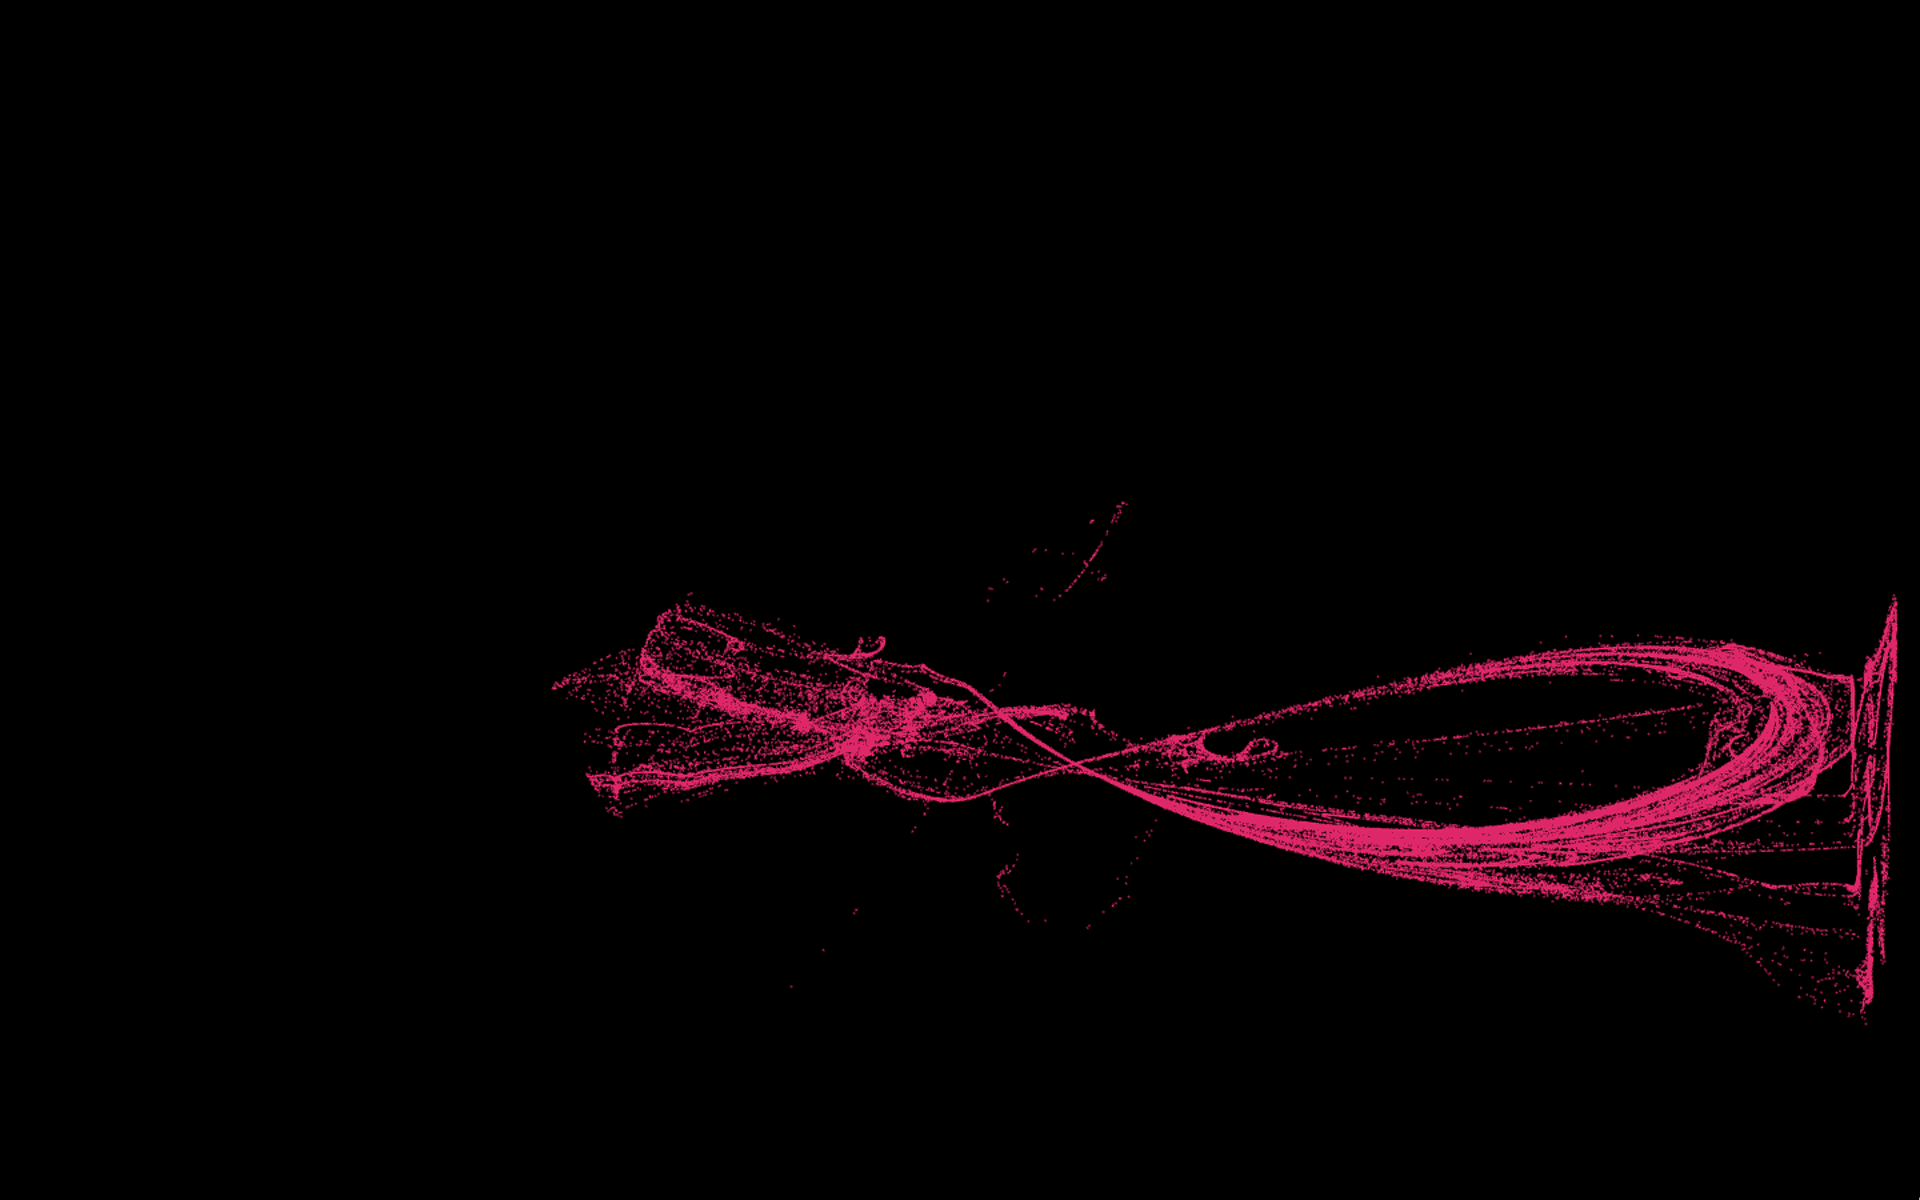
Images from Visualization
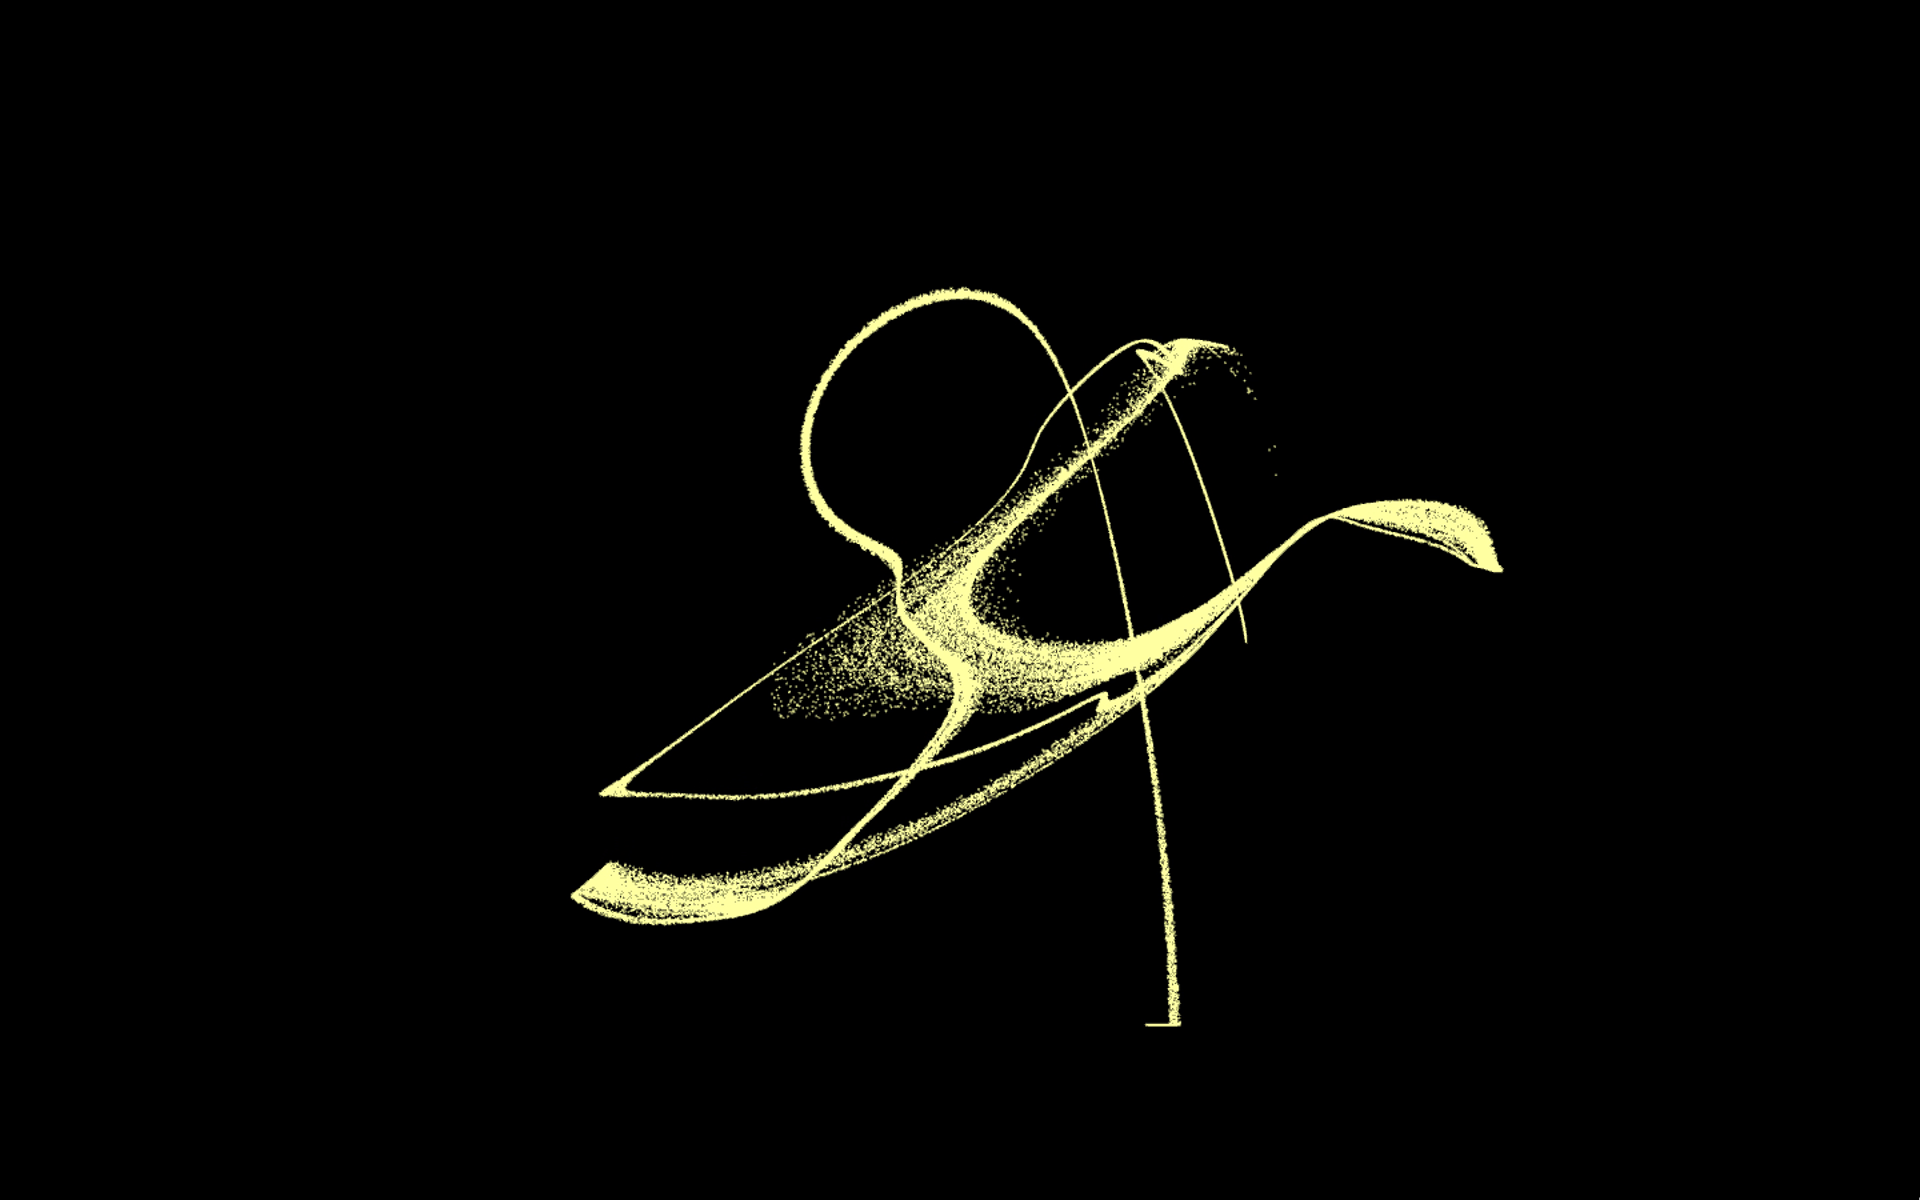
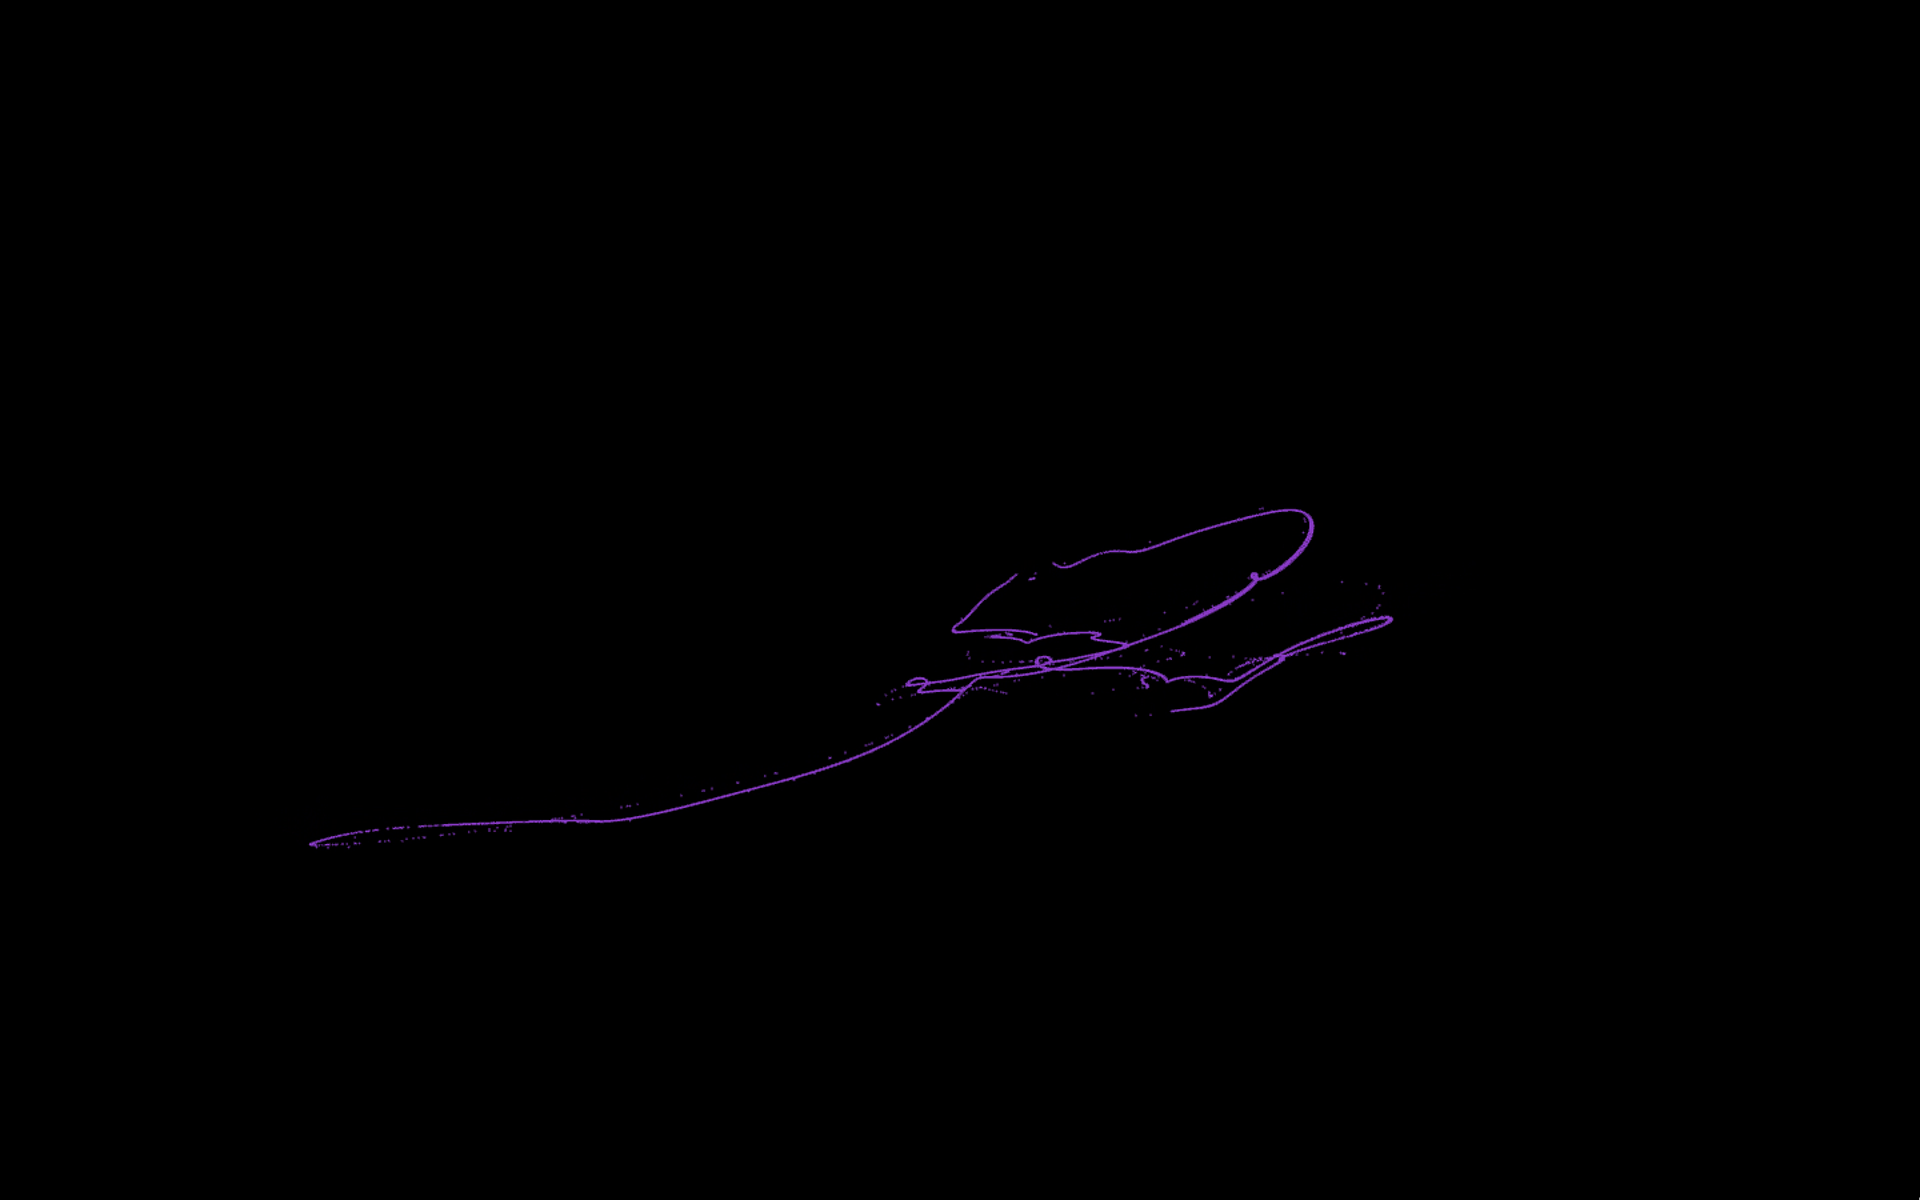
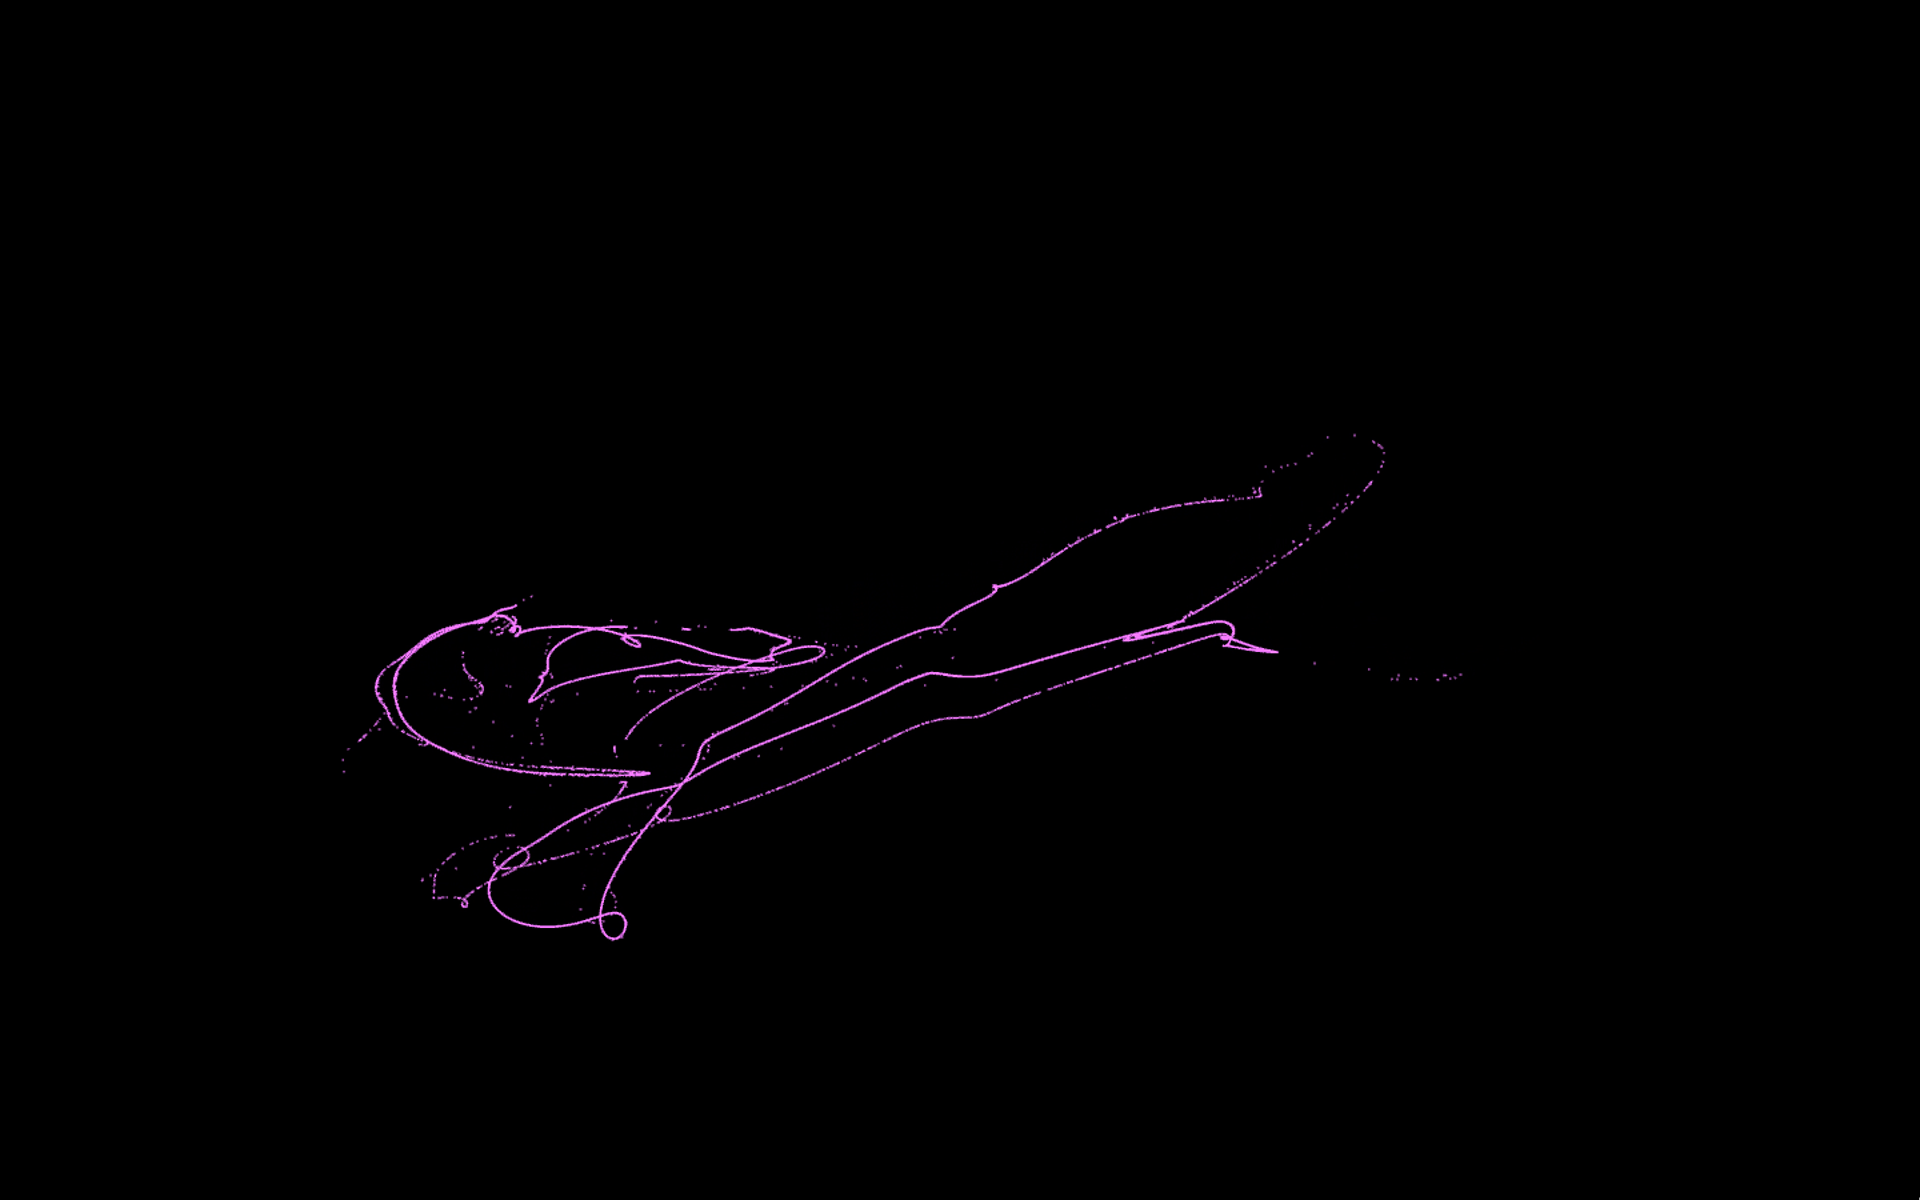
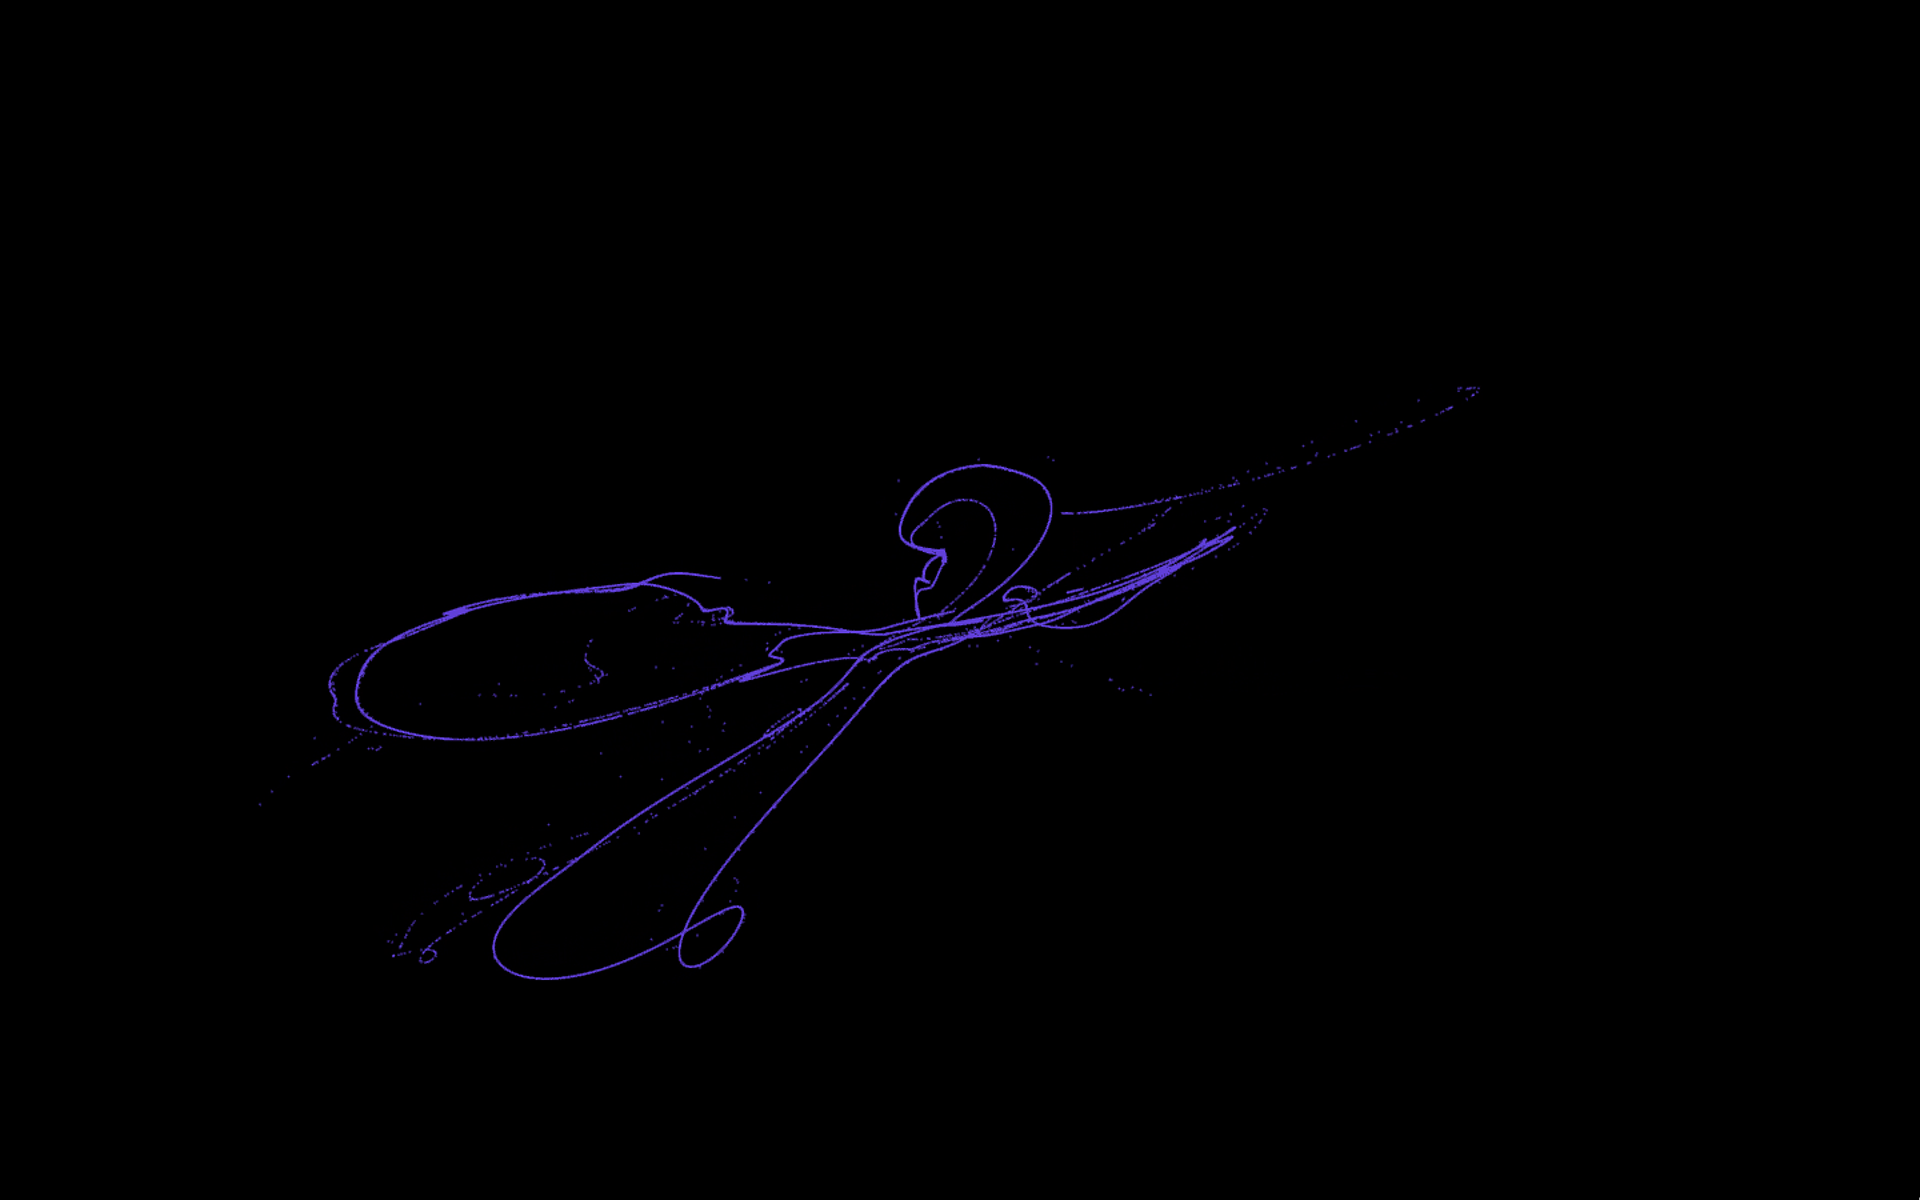

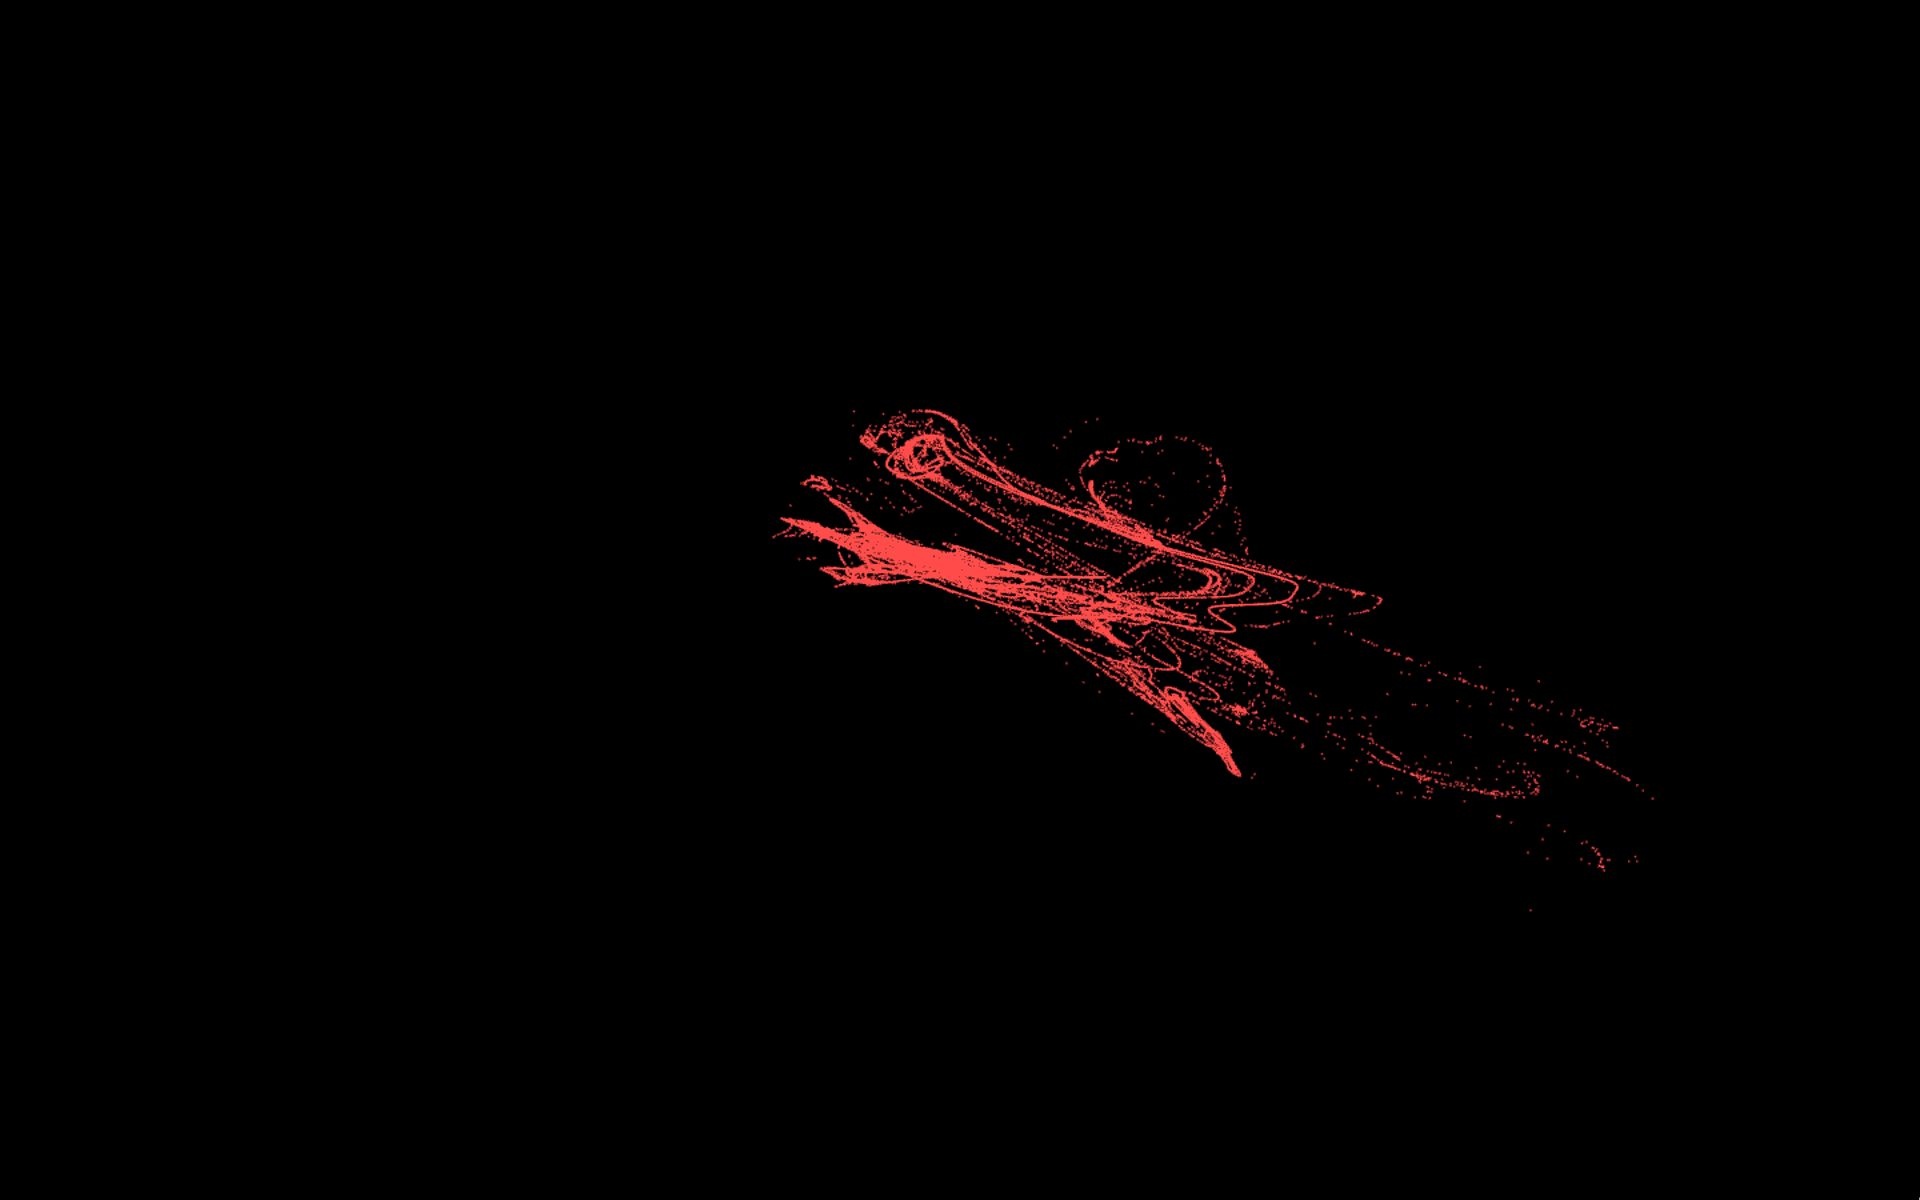
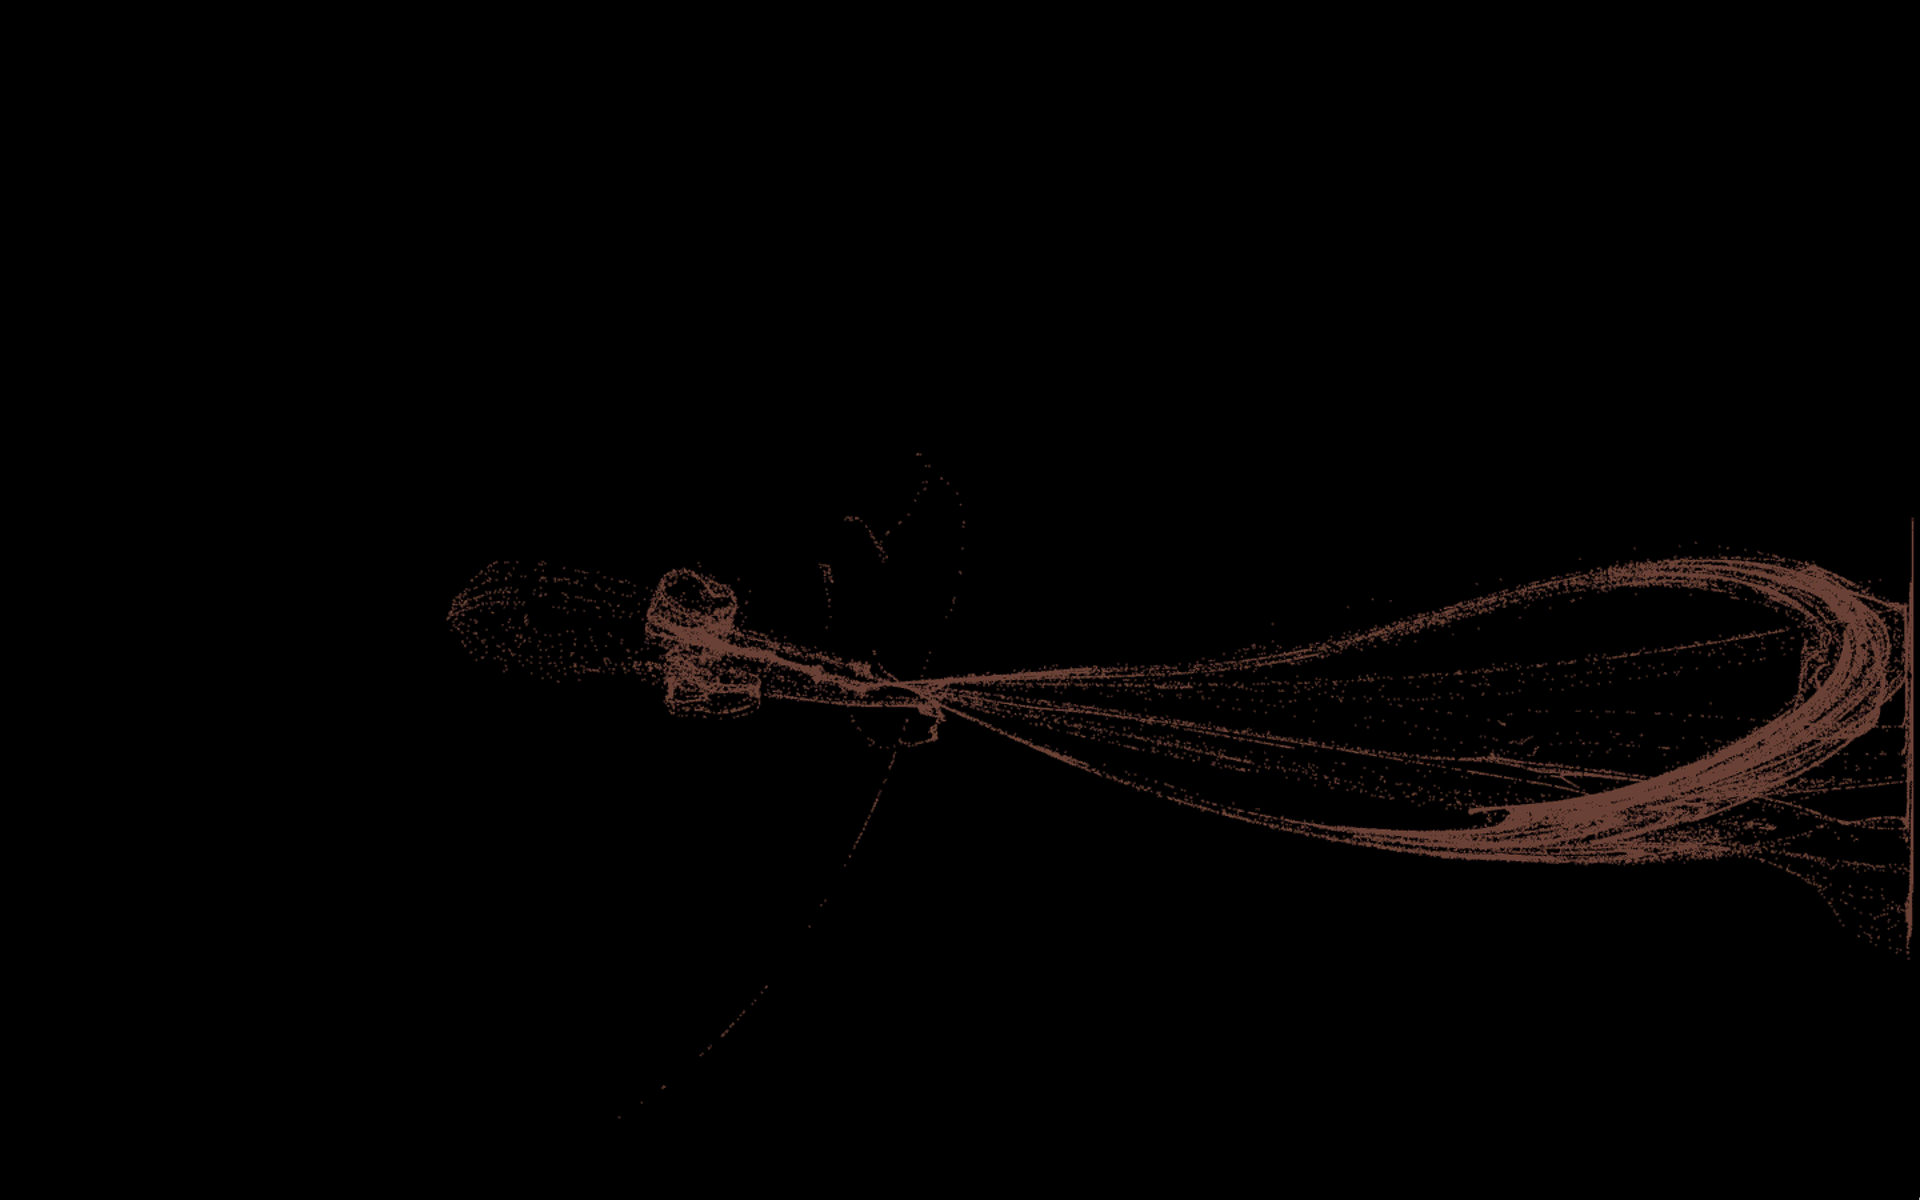
The purpose of this project is to bring greater attention and understanding to the practice of meditation and its effects on the brain and thus on ourselves. I believe that there is a gap in people’s belief and understanding of this practice and that there are few examples to help bridge that gap. I want people to walk away from my project feeling more empowered in their ability to affect change in their own mental state and wanting to pick up meditation as a lifelong practice. I want to show that this can be done by anyone at any time and that the science and the theory really are backed up and can be shown visually.
Thank you for checking out my Senior Capstone Project!
Special Thanks to...
Kelly Enright
Mori Bhagvta
David & Barri Rafferty